

508
Y. Folkman and A.M. Wachs
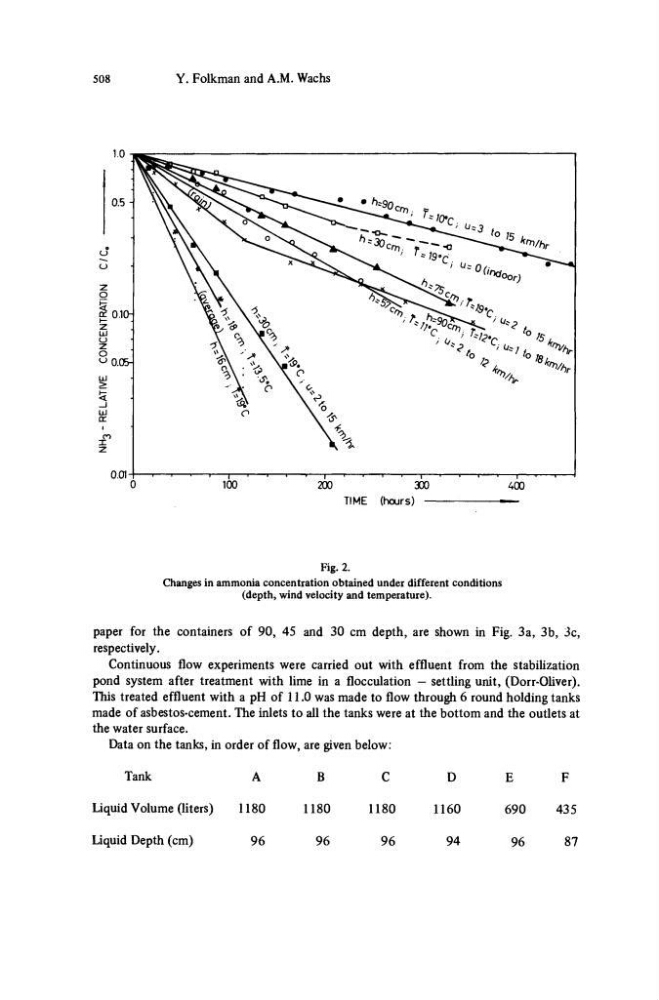
TIME (hours)
Fig. 2.
Changes in ammonia concentration obtained under different conditions
(depth, wind velocity and temperature).
paper for the containers of 90, 45 and 30 cm depth, are shown in Fig. 3a, 3b, 3c,
respectively.
Continuous flow experiments were carried out with effluent from the stabilization
pond system after treatment with lime in a flocculation - settling unit, (Dorr-Oliver).
This treated effluent with a pH of 11.0 was made to flow through 6 round holding tanks
made of asbestos-cement. The inlets to all the tanks were at the bottom and the outlets at
the water surface.
Data on the tanks, in order of flow, are given below:
Tank
A
B
C
D
E
F
Liquid Volume (liters)
1180
1180
1180
1160
690
435
Liquid Depth (cm)
96
96
96
94
96
87
Y. Folkman and A.M. Wachs
TIME (hours)
Fig. 2.
Changes in ammonia concentration obtained under different conditions
(depth, wind velocity and temperature).
paper for the containers of 90, 45 and 30 cm depth, are shown in Fig. 3a, 3b, 3c,
respectively.
Continuous flow experiments were carried out with effluent from the stabilization
pond system after treatment with lime in a flocculation - settling unit, (Dorr-Oliver).
This treated effluent with a pH of 11.0 was made to flow through 6 round holding tanks
made of asbestos-cement. The inlets to all the tanks were at the bottom and the outlets at
the water surface.
Data on the tanks, in order of flow, are given below:
Tank
A
B
C
D
E
F
Liquid Volume (liters)
1180
1180
1180
1160
690
435
Liquid Depth (cm)
96
96
96
94
96
87