

438
Discussion
initially, with tap water and blended daily; the third sample was blended daily and the fourth sample
was a control. This Figure shows that after 4 or 5 days of digestion, all the blended samples had better
drainability than the control sludge. Particularly the drainability for the sludge which was washed with
buffer and blended, had improved considerably after 3 days. However, the effect of blending on the
drainability characteristics was not always consistent.
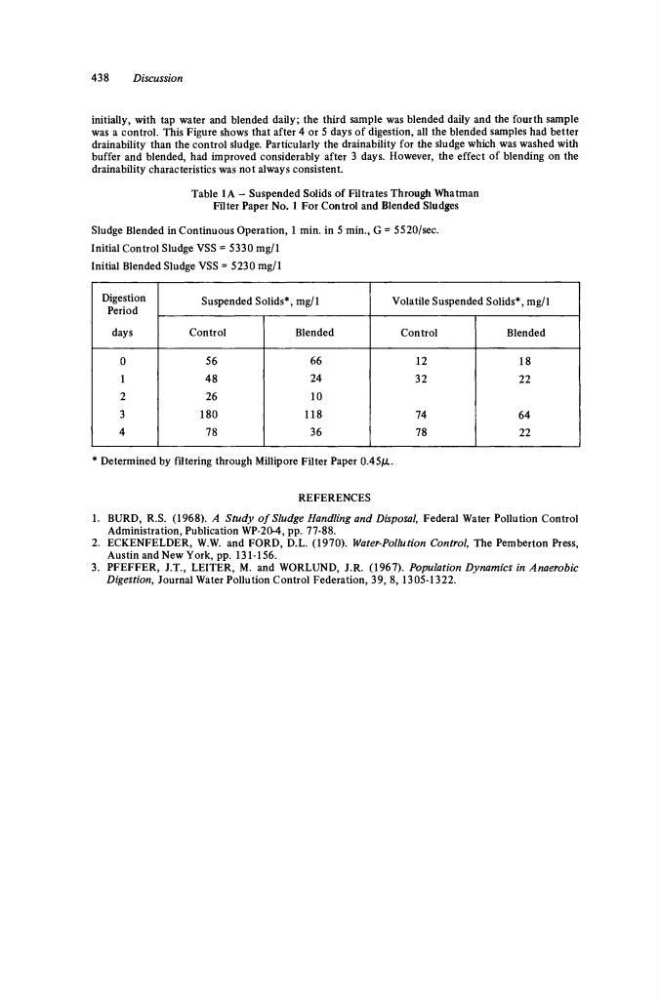
Table 1A - Suspended Solids of Filtrates Through Whatman
Filter Paper No. 1 For Control and Blended Sludges
Sludge Blended in Continuous Operation, 1 min. in 5 min., G = 5520/sec.
Initial Control Sludge VSS = 5330 mg/1
Initial Blended Sludge VSS = 5230 mg/1
Digestion
Period
days
0
1
2
3
4
Suspended Solids*, mg/1
Control
56
48
26
180
78
Blended
66
24
10
118
36
Volatile Suspended Solids*, mg/1
Control
12
32
74
78
Blended
18
22
64
1
22
* Determined by filtering through Millipore Filter Paper 0.45jU..
REFERENCES
1. BURD, R.S. (1968). A Study of Sludge Handling and Disposal, Federal Water Pollution Control
Administration, Publication WP-20-4, pp. 77-88.
2. ECKENFELDER, W.W. and FORD, D.L. (1970). Water-Pollution Control, The Pemberton Press,
Austin and New York, pp. 131-156.
3. PFEFFER, J.T., LEITER, M. and WORLUND, J.R. (1967). Population Dynamics in Anaerobic
Digestion, Journal Water Pollution Control Federation, 39, 8, 1305-1322.
Discussion
initially, with tap water and blended daily; the third sample was blended daily and the fourth sample
was a control. This Figure shows that after 4 or 5 days of digestion, all the blended samples had better
drainability than the control sludge. Particularly the drainability for the sludge which was washed with
buffer and blended, had improved considerably after 3 days. However, the effect of blending on the
drainability characteristics was not always consistent.
Table 1A - Suspended Solids of Filtrates Through Whatman
Filter Paper No. 1 For Control and Blended Sludges
Sludge Blended in Continuous Operation, 1 min. in 5 min., G = 5520/sec.
Initial Control Sludge VSS = 5330 mg/1
Initial Blended Sludge VSS = 5230 mg/1
Digestion
Period
days
0
1
2
3
4
Suspended Solids*, mg/1
Control
56
48
26
180
78
Blended
66
24
10
118
36
Volatile Suspended Solids*, mg/1
Control
12
32
74
78
Blended
18
22
64
1
22
* Determined by filtering through Millipore Filter Paper 0.45jU..
REFERENCES
1. BURD, R.S. (1968). A Study of Sludge Handling and Disposal, Federal Water Pollution Control
Administration, Publication WP-20-4, pp. 77-88.
2. ECKENFELDER, W.W. and FORD, D.L. (1970). Water-Pollution Control, The Pemberton Press,
Austin and New York, pp. 131-156.
3. PFEFFER, J.T., LEITER, M. and WORLUND, J.R. (1967). Population Dynamics in Anaerobic
Digestion, Journal Water Pollution Control Federation, 39, 8, 1305-1322.