

422
S.D. Bokil and J.K. Bewtra
and the probe level was adjusted so that no air bubbles were trapped inside the chamber.
The temperature of the sample in the probe chamber was maintained at 20 ± 1°C.
For total plate count of bacteria, one ml of sludge was withdrawn from each aeration
jar, diluted to 100 ml and blended for one minute. It was diluted further to make 1 litre,
and the plate counts were made according to the Standard Methods (1965).
The mechanical energy input to the fluid due to blending is expressed as the mean
velocity gradient, G, imparted to the fluid mass. The following relationship for G in sec"
1 ,
as developed by Camp and Stein (1943), was used:
MV
0)
where P is the power input in dyne.cm/sec, μ is the viscosity of the fluid in dyne.sec/sq
cm and V is the volume of the fluid in ml to which the power input is applied.
The sludge was assumed to behave as a Bingham plastic and its viscosity was
determined with Brookfield Synchrolectric Viscometer. Realizing that the plastic
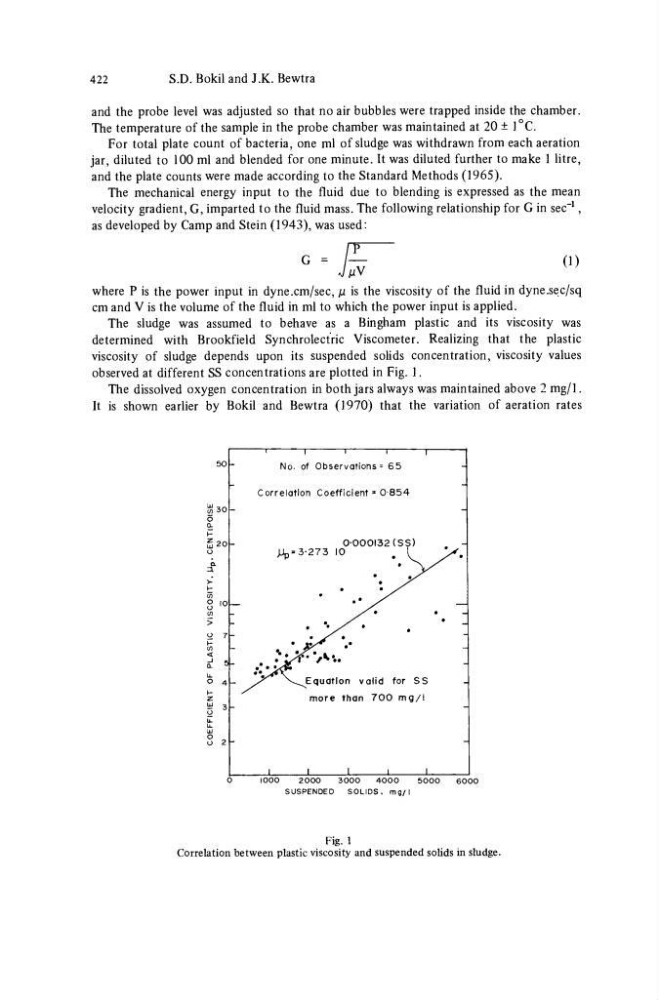
viscosity of sludge depends upon its suspended solids concentration, viscosity values
observed at different SS concentrations are plotted in Fig. 1.
The dissolved oxygen concentration in both jars always was maintained above 2 mg/1.
It is shown earlier by Bokil and Bewtra (1970) that the variation of aeration rates
£ io
I
|
1
1
p
No. of Observations = 6 5
Correlation Coefficient ■ 0-854
JJp*3-273 10
0-000132 (SS)
Equation valid for SS
more than 7 0 0 m g / l
1000
2 0 0 0
3000
4 0 0 0
5 0 0 0
SUSPENDED
SOLIDS, m g / l
Fig. 1
Correlation between plastic viscosity and suspended solids in sludge.
S.D. Bokil and J.K. Bewtra
and the probe level was adjusted so that no air bubbles were trapped inside the chamber.
The temperature of the sample in the probe chamber was maintained at 20 ± 1°C.
For total plate count of bacteria, one ml of sludge was withdrawn from each aeration
jar, diluted to 100 ml and blended for one minute. It was diluted further to make 1 litre,
and the plate counts were made according to the Standard Methods (1965).
The mechanical energy input to the fluid due to blending is expressed as the mean
velocity gradient, G, imparted to the fluid mass. The following relationship for G in sec"
1 ,
as developed by Camp and Stein (1943), was used:
MV
0)
where P is the power input in dyne.cm/sec, μ is the viscosity of the fluid in dyne.sec/sq
cm and V is the volume of the fluid in ml to which the power input is applied.
The sludge was assumed to behave as a Bingham plastic and its viscosity was
determined with Brookfield Synchrolectric Viscometer. Realizing that the plastic
viscosity of sludge depends upon its suspended solids concentration, viscosity values
observed at different SS concentrations are plotted in Fig. 1.
The dissolved oxygen concentration in both jars always was maintained above 2 mg/1.
It is shown earlier by Bokil and Bewtra (1970) that the variation of aeration rates
£ io
I
|
1
1
p
No. of Observations = 6 5
Correlation Coefficient ■ 0-854
JJp*3-273 10
0-000132 (SS)
Equation valid for SS
more than 7 0 0 m g / l
1000
2 0 0 0
3000
4 0 0 0
5 0 0 0
SUSPENDED
SOLIDS, m g / l
Fig. 1
Correlation between plastic viscosity and suspended solids in sludge.