

412
W. Torpey, H. Heukelekian, A.J. Kaplovsky and R. Epstein
which effected about 90% removal of B.O.D. 5 , a sharp increase in the rate of filtration
was found.
The performance of the algal units will not be reported herein as it is outside the scope
of this paper.
ADSORPTION BY ACTIVATED CARBON
Treatment of the effluent from the algal unit to remove residual organics was started
in March, 1970, and continued through November, 1970. All the data secured during the
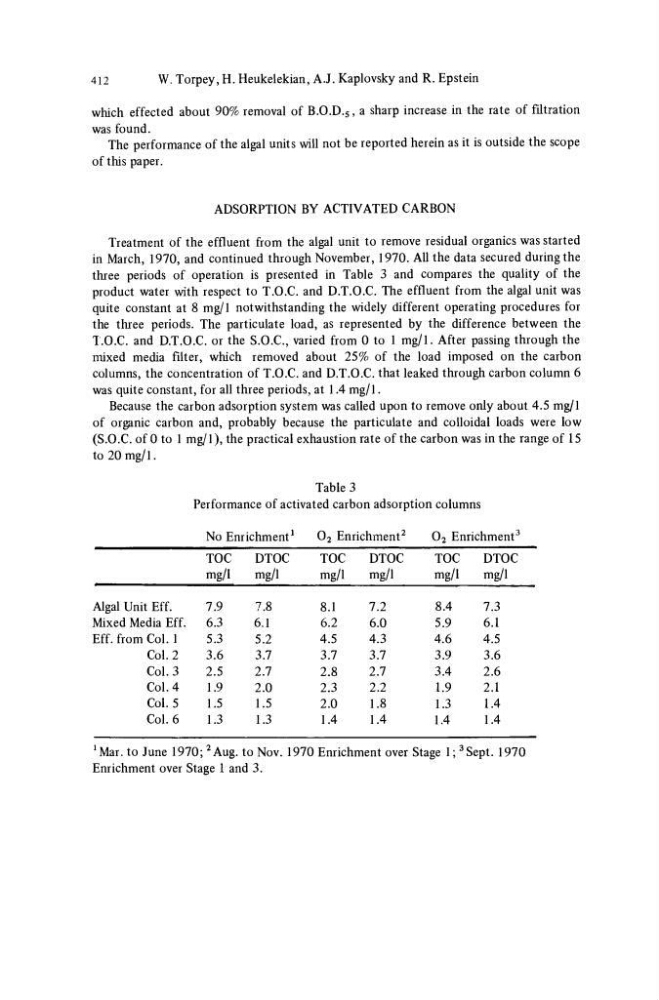
three periods of operation is presented in Table 3 and compares the quality of the
product water with respect to T.O.C. and D.T.O.C. The effluent from the algal unit was
quite constant at 8 mg/1 notwithstanding the widely different operating procedures for
the three periods. The particulate load, as represented by the difference between the
T.O.C. and D.T.O.C. or the S.O.C., varied from 0 to 1 mg/1. After passing through the
mixed media filter, which removed about 25% of the load imposed on the carbon
columns, the concentration of T.O.C. and D.T.O.C. that leaked through carbon column 6
was quite constant, for all three periods, at 1.4 mg/1.
Because the carbon adsorption system was called upon to remove only about 4.5 mg/1
of organic carbon and, probably because the particulate and colloidal loads were low
(S.O.C. of 0 to 1 mg/1), the practical exhaustion rate of the carbon was in the range of 15
to 20 mg/1.
Table 3
Performance of activated carbon adsorption columns
No Enrichment
1
0 2 Enrichment
2
0 2 Enrichment
3
TOC
DTOC
TOC
DTOC
TOC
DTOC
mg/1
mg/1
mg/1
mg/1
mg/1
mg/1
Algal Unit Eff.
Mixed Media Eff.
Eff. from Col. 1
Col. 2
Col. 3
Col. 4
Col. 5
Col. 6
7.9
6.3
5.3
3.6
2.5
1.9
1.5
1.3
7.8
6.1
5.2
3.7
2.7
2.0
1.5
1.3
8.1
6.2
4.5
3.7
2.8
2.3
2.0
1.4
7.2
6.0
4.3
3.7
2.7
2.2
1.8
1.4
8.4
5.9
4.6
3.9
3.4
1.9
1.3
1.4
7.3
6.1
4.5
3.6
2.6
2.1
1.4
1.4
*Mar. to June 1970;
2 Aug. to Nov. 1970 Enrichment over Stage 1;
3 Sept. 1970
Enrichment over Stage 1 and 3.
W. Torpey, H. Heukelekian, A.J. Kaplovsky and R. Epstein
which effected about 90% removal of B.O.D. 5 , a sharp increase in the rate of filtration
was found.
The performance of the algal units will not be reported herein as it is outside the scope
of this paper.
ADSORPTION BY ACTIVATED CARBON
Treatment of the effluent from the algal unit to remove residual organics was started
in March, 1970, and continued through November, 1970. All the data secured during the
three periods of operation is presented in Table 3 and compares the quality of the
product water with respect to T.O.C. and D.T.O.C. The effluent from the algal unit was
quite constant at 8 mg/1 notwithstanding the widely different operating procedures for
the three periods. The particulate load, as represented by the difference between the
T.O.C. and D.T.O.C. or the S.O.C., varied from 0 to 1 mg/1. After passing through the
mixed media filter, which removed about 25% of the load imposed on the carbon
columns, the concentration of T.O.C. and D.T.O.C. that leaked through carbon column 6
was quite constant, for all three periods, at 1.4 mg/1.
Because the carbon adsorption system was called upon to remove only about 4.5 mg/1
of organic carbon and, probably because the particulate and colloidal loads were low
(S.O.C. of 0 to 1 mg/1), the practical exhaustion rate of the carbon was in the range of 15
to 20 mg/1.
Table 3
Performance of activated carbon adsorption columns
No Enrichment
1
0 2 Enrichment
2
0 2 Enrichment
3
TOC
DTOC
TOC
DTOC
TOC
DTOC
mg/1
mg/1
mg/1
mg/1
mg/1
mg/1
Algal Unit Eff.
Mixed Media Eff.
Eff. from Col. 1
Col. 2
Col. 3
Col. 4
Col. 5
Col. 6
7.9
6.3
5.3
3.6
2.5
1.9
1.5
1.3
7.8
6.1
5.2
3.7
2.7
2.0
1.5
1.3
8.1
6.2
4.5
3.7
2.8
2.3
2.0
1.4
7.2
6.0
4.3
3.7
2.7
2.2
1.8
1.4
8.4
5.9
4.6
3.9
3.4
1.9
1.3
1.4
7.3
6.1
4.5
3.6
2.6
2.1
1.4
1.4
*Mar. to June 1970;
2 Aug. to Nov. 1970 Enrichment over Stage 1;
3 Sept. 1970
Enrichment over Stage 1 and 3.