

408
W. Torpey, H. Heukelekian, A.J. Kaplovsky, and R. Epstein
Q
Ö
Legend
x Jul. to Nov. 1969 ,
normal atmospere over
all stages
O Aug . to Nov. 1970
(excl . Sept.) with oxygen
enrichment over stage I
1
2
3
4
5
6
7
8
9
10
Stage No.
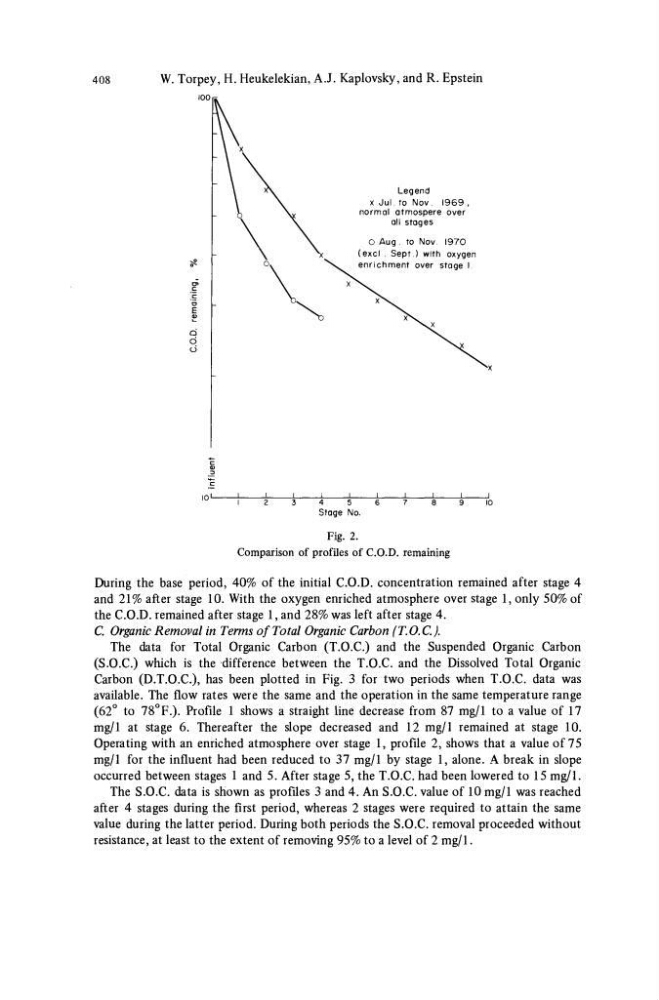
Fig. 2.
Comparison of profiles of C.O.D. remaining
During the base period, 40% of the initial C.O.D. concentration remained after stage 4
and 21% after stage 10. With the oxygen enriched atmosphere over stage 1, only 50% of
the C.O.D. remained after stage 1, and 28% was left after stage 4.
C. Organic Removal in Terms of Total Organic Carbon (T.O.C).
The data for Total Organic Carbon (T.O.C.) and the Suspended Organic Carbon
(S.O.C.) which is the difference between the T.O.C. and the Dissolved Total Organic
Carbon (D.T.O.C), has been plotted in Fig. 3 for two periods when T.O.C. data was
available. The flow rates were the same and the operation in the same temperature range
(62° to 78° F.). Profile 1 shows a straight line decrease from 87 mg/1 to a value of 17
mg/1 at stage 6. Thereafter the slope decreased and 12 mg/1 remained at stage 10.
Operating with an enriched atmosphere over stage 1, profile 2, shows that a value of 75
mg/1 for the influent had been reduced to 37 mg/1 by stage 1, alone. A break in slope
occurred between stages 1 and 5. After stage 5, the T.O.C. had been lowered to 15 mg/1.
The S.O.C. data is shown as profiles 3 and 4. An S.O.C. value of 10 mg/1 was reached
after 4 stages during the first period, whereas 2 stages were required to attain the same
value during the latter period. During both periods the S.O.C. removal proceeded without
resistance, at least to the extent of removing 95% to a level of 2 mg/1.
W. Torpey, H. Heukelekian, A.J. Kaplovsky, and R. Epstein
Q
Ö
Legend
x Jul. to Nov. 1969 ,
normal atmospere over
all stages
O Aug . to Nov. 1970
(excl . Sept.) with oxygen
enrichment over stage I
1
2
3
4
5
6
7
8
9
10
Stage No.
Fig. 2.
Comparison of profiles of C.O.D. remaining
During the base period, 40% of the initial C.O.D. concentration remained after stage 4
and 21% after stage 10. With the oxygen enriched atmosphere over stage 1, only 50% of
the C.O.D. remained after stage 1, and 28% was left after stage 4.
C. Organic Removal in Terms of Total Organic Carbon (T.O.C).
The data for Total Organic Carbon (T.O.C.) and the Suspended Organic Carbon
(S.O.C.) which is the difference between the T.O.C. and the Dissolved Total Organic
Carbon (D.T.O.C), has been plotted in Fig. 3 for two periods when T.O.C. data was
available. The flow rates were the same and the operation in the same temperature range
(62° to 78° F.). Profile 1 shows a straight line decrease from 87 mg/1 to a value of 17
mg/1 at stage 6. Thereafter the slope decreased and 12 mg/1 remained at stage 10.
Operating with an enriched atmosphere over stage 1, profile 2, shows that a value of 75
mg/1 for the influent had been reduced to 37 mg/1 by stage 1, alone. A break in slope
occurred between stages 1 and 5. After stage 5, the T.O.C. had been lowered to 15 mg/1.
The S.O.C. data is shown as profiles 3 and 4. An S.O.C. value of 10 mg/1 was reached
after 4 stages during the first period, whereas 2 stages were required to attain the same
value during the latter period. During both periods the S.O.C. removal proceeded without
resistance, at least to the extent of removing 95% to a level of 2 mg/1.