

392
D.B. Cohen
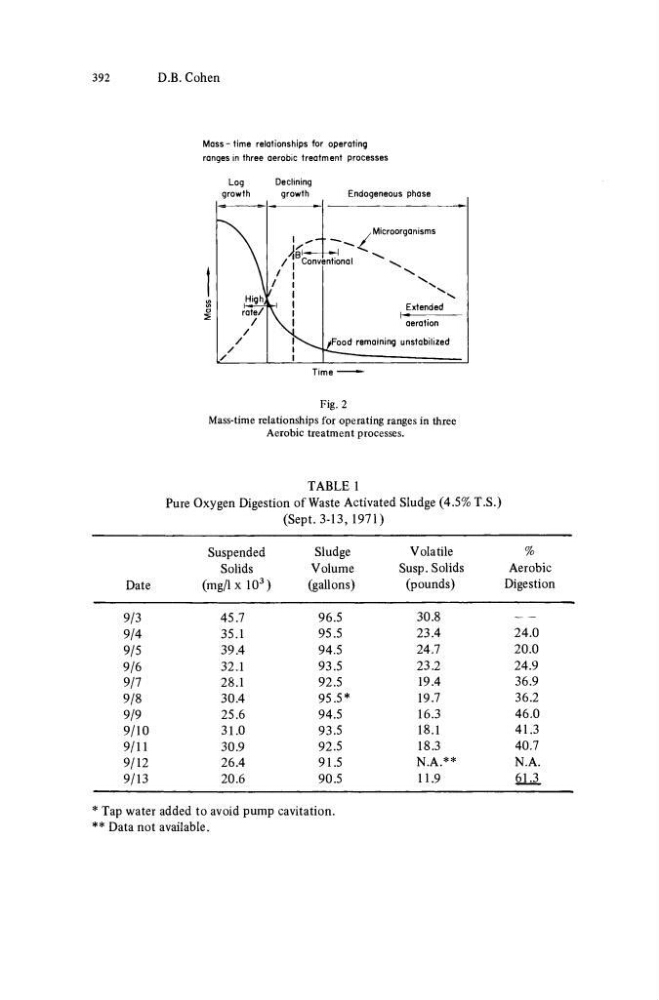
Mass-time relationships for operating
ranges in three aerobic treatment processes
Log
growth
Declining
growth
Endogeneous phase
.Microorganisms
aeration
ood remaining unstabilized
Time
■
Fig. 2
Mass-time relationships for operating ranges in three
Aerobic treatment processes.
TABLE 1
Pure Oxygen Digestion of Waste Activated Sludge (4.5% T.S.)
(Sept. 3-13, 1971)
Date
9/3
9/4
9/5
9/6
9/7
9/8
9/9
9/10
9/11
9/12
9/13
Suspended
Solids
(mg/lxlO
3 )
45.7
35.1
39.4
32.1
28.1
30.4
25.6
31.0
30.9
26.4
20.6
Sludge
Volume
(gallons)
96.5
95.5
94.5
93.5
92.5
95.5*
94.5
93.5
92.5
91.5
90.5
Volatile
Susp. Solids
(pounds)
30.8
23.4
24.7
23.2
19.4
19.7
16.3
18.1
18.3
N.A.**
11.9
%
Aerobic
Digestion
24.0
20.0
24.9
36.9
36.2
46.0
41.3
40.7
N.A.
61.3
* Tap water added to avoid pump cavitation.
** Data not available.
D.B. Cohen
Mass-time relationships for operating
ranges in three aerobic treatment processes
Log
growth
Declining
growth
Endogeneous phase
.Microorganisms
aeration
ood remaining unstabilized
Time
■
Fig. 2
Mass-time relationships for operating ranges in three
Aerobic treatment processes.
TABLE 1
Pure Oxygen Digestion of Waste Activated Sludge (4.5% T.S.)
(Sept. 3-13, 1971)
Date
9/3
9/4
9/5
9/6
9/7
9/8
9/9
9/10
9/11
9/12
9/13
Suspended
Solids
(mg/lxlO
3 )
45.7
35.1
39.4
32.1
28.1
30.4
25.6
31.0
30.9
26.4
20.6
Sludge
Volume
(gallons)
96.5
95.5
94.5
93.5
92.5
95.5*
94.5
93.5
92.5
91.5
90.5
Volatile
Susp. Solids
(pounds)
30.8
23.4
24.7
23.2
19.4
19.7
16.3
18.1
18.3
N.A.**
11.9
%
Aerobic
Digestion
24.0
20.0
24.9
36.9
36.2
46.0
41.3
40.7
N.A.
61.3
* Tap water added to avoid pump cavitation.
** Data not available.