

Discussion
323
overflow pumping stations within the Metropolitan Sanitary District system for the year 1971. It may
be noted that the averages for each storm even ranged as follows:
Suspended Solids 209 to 494, Volatile Suspended Solids 82 to 269, BOD 63 to 138, Total
Nitrogen 11.8 to 16.1, NH 3 -N 5.5 to 9.2, Total Phosphorus 1.8 to 10.0.
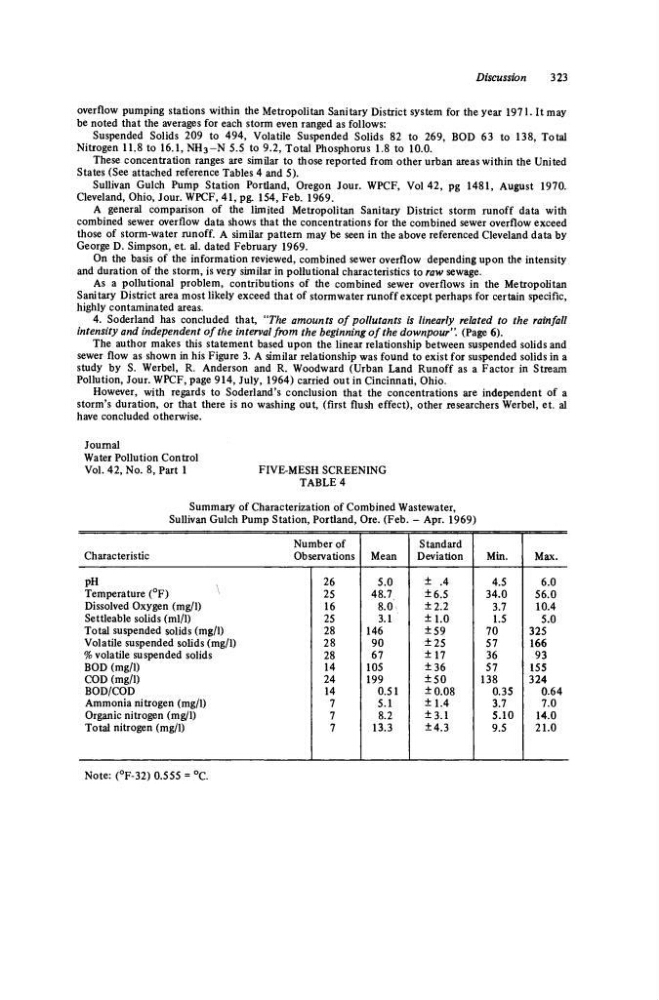
These concentration ranges are similar to those reported from other urban areas within the United
States (See attached reference Tables 4 and 5).
Sullivan Gulch Pump Station Portland, Oregon Jour. WPCF, Vol 42, pg 1481, August 1970.
Cleveland, Ohio, Jour. WPCF, 41, pg. 154, Feb. 1969.
A general comparison of the limited Metropolitan Sanitary District storm runoff data with
combined sewer overflow data shows that the concentrations for the combined sewer overflow exceed
those of storm-water runoff. A similar pattern may be seen in the above referenced Cleveland data by
George D. Simpson, et. al. dated February 1969.
On the basis of the information reviewed, combined sewer overflow depending upon the intensity
and duration of the storm, is very similar in pollutional characteristics to raw sewage.
As a pollutional problem, contributions of the combined sewer overflows in the Metropolitan
Sanitary District area most likely exceed that of stormwater runoff except perhaps for certain specific,
highly contaminated areas.
4. Soderland has concluded that, "The amounts of pollutants is linearly related to the rainfall
intensity and independent of the interval from the beginning of the downpour". (Page 6).
The author makes this statement based upon the linear relationship between suspended solids and
sewer flow as shown in his Figure 3. A similar relationship was found to exist for suspended solids in a
study by S. Werbel, R. Anderson and R. Woodward (Urban Land Runoff as a Factor in Stream
Pollution, Jour. WPCF, page 914, July, 1964) carried out in Cincinnati, Ohio.
However, with regards to Soderland's conclusion that the concentrations are independent of a
storm's duration, or that there is no washing out, (first flush effect), other researchers Werbel, et. al
have concluded otherwise.
Journal
Water Pollution Control
Vol. 42, No. 8, Part 1
FIVE-MESH SCREENING
TABLE 4
Summary of Characterization of Combined Wastewater,
Sullivan Gulch Pump Station, Portland, Ore. (Feb. - Apr. 1969)
Number of
Characteristic
Observations
pH
Temperature (°F)
^
Dissolved Oxygen (mg/1)
Settleable solids (ml/1)
Total suspended solids (mg/1)
Volatile suspended solids (mg/1)
% volatile suspended solids
BOD (mg/1)
COD (mg/1)
BOD/COD
Ammonia nitrogen (mg/1)
Organic nitrogen (mg/1)
Total nitrogen (mg/1)
26
25
16
25
28
28
28
14
24
14
7
7
7
Mean
5.0
48.7
8.0
3.1
146
90
67
105
199
0.51
5.1
8.2
13.3
Standard
Deviation
± .4
±6.5
±2.2
±1.0
±59
±25
±17
±36
±50
±0.08
±1.4
±3.1
±4.3
1
Min.
4.5
34.0
3.7
1.5
70
57
36
57
138
0.35
3.7
5.10
9.5
Max.
6.0
56.0
10.4
5.0
325
166
93
155
324
0.64
7.0
14.0
21.0
Note: (°F-32) 0.555 = °C.
323
overflow pumping stations within the Metropolitan Sanitary District system for the year 1971. It may
be noted that the averages for each storm even ranged as follows:
Suspended Solids 209 to 494, Volatile Suspended Solids 82 to 269, BOD 63 to 138, Total
Nitrogen 11.8 to 16.1, NH 3 -N 5.5 to 9.2, Total Phosphorus 1.8 to 10.0.
These concentration ranges are similar to those reported from other urban areas within the United
States (See attached reference Tables 4 and 5).
Sullivan Gulch Pump Station Portland, Oregon Jour. WPCF, Vol 42, pg 1481, August 1970.
Cleveland, Ohio, Jour. WPCF, 41, pg. 154, Feb. 1969.
A general comparison of the limited Metropolitan Sanitary District storm runoff data with
combined sewer overflow data shows that the concentrations for the combined sewer overflow exceed
those of storm-water runoff. A similar pattern may be seen in the above referenced Cleveland data by
George D. Simpson, et. al. dated February 1969.
On the basis of the information reviewed, combined sewer overflow depending upon the intensity
and duration of the storm, is very similar in pollutional characteristics to raw sewage.
As a pollutional problem, contributions of the combined sewer overflows in the Metropolitan
Sanitary District area most likely exceed that of stormwater runoff except perhaps for certain specific,
highly contaminated areas.
4. Soderland has concluded that, "The amounts of pollutants is linearly related to the rainfall
intensity and independent of the interval from the beginning of the downpour". (Page 6).
The author makes this statement based upon the linear relationship between suspended solids and
sewer flow as shown in his Figure 3. A similar relationship was found to exist for suspended solids in a
study by S. Werbel, R. Anderson and R. Woodward (Urban Land Runoff as a Factor in Stream
Pollution, Jour. WPCF, page 914, July, 1964) carried out in Cincinnati, Ohio.
However, with regards to Soderland's conclusion that the concentrations are independent of a
storm's duration, or that there is no washing out, (first flush effect), other researchers Werbel, et. al
have concluded otherwise.
Journal
Water Pollution Control
Vol. 42, No. 8, Part 1
FIVE-MESH SCREENING
TABLE 4
Summary of Characterization of Combined Wastewater,
Sullivan Gulch Pump Station, Portland, Ore. (Feb. - Apr. 1969)
Number of
Characteristic
Observations
pH
Temperature (°F)
^
Dissolved Oxygen (mg/1)
Settleable solids (ml/1)
Total suspended solids (mg/1)
Volatile suspended solids (mg/1)
% volatile suspended solids
BOD (mg/1)
COD (mg/1)
BOD/COD
Ammonia nitrogen (mg/1)
Organic nitrogen (mg/1)
Total nitrogen (mg/1)
26
25
16
25
28
28
28
14
24
14
7
7
7
Mean
5.0
48.7
8.0
3.1
146
90
67
105
199
0.51
5.1
8.2
13.3
Standard
Deviation
± .4
±6.5
±2.2
±1.0
±59
±25
±17
±36
±50
±0.08
±1.4
±3.1
±4.3
1
Min.
4.5
34.0
3.7
1.5
70
57
36
57
138
0.35
3.7
5.10
9.5
Max.
6.0
56.0
10.4
5.0
325
166
93
155
324
0.64
7.0
14.0
21.0
Note: (°F-32) 0.555 = °C.