

224
H. Leventer
In January 1971 the organic content was 12.4%. A similar content, with slight
fluctuations of around 1 percent was observed during March to June (Fig. 2). In July a
slight drop to 11.2% occurred and to 10.6% in August. The nitrogen content remained at
0.74 to o.96%.
The difference between 1968 and 1971 was pronounced during May to June, when no
great rise in organic content occurred in 1971 as in 1968.
Dissolved oxygen content near reservoir bottom
In March to July every year a high demand for oxygen occurs in the Tsalmon
Reservoir. In 1968, during the period January to April, oxygen concentration in the
water over the reservoir bottom varied between 95 and 105 percent of saturation. In
April the oxygen content began to fall to 60%, and this concentration, with slight
variations persisted in May and June (Fig. 3). In July the oxygen content rose to 95% and
this concentration, with slight rises, was observed in the water until January.
In 1971,100% oxygen saturation was observed in January. The concentration rose to
115% in March, followed by a gradual decline, until in June and July it was 82 percent,
followed again by a rise as in 1968.
Thus, between 1971 and 1968 about 20% more dissolved oxygen was present in the
period May to June.
Flora in the Reservoir
The phytoplankton in the Tsalmon Reservoir has its origin in Lake Kinneret and the
open canals. Owing to the brief detention of the water in the reservoir of 4 to 24 hours,
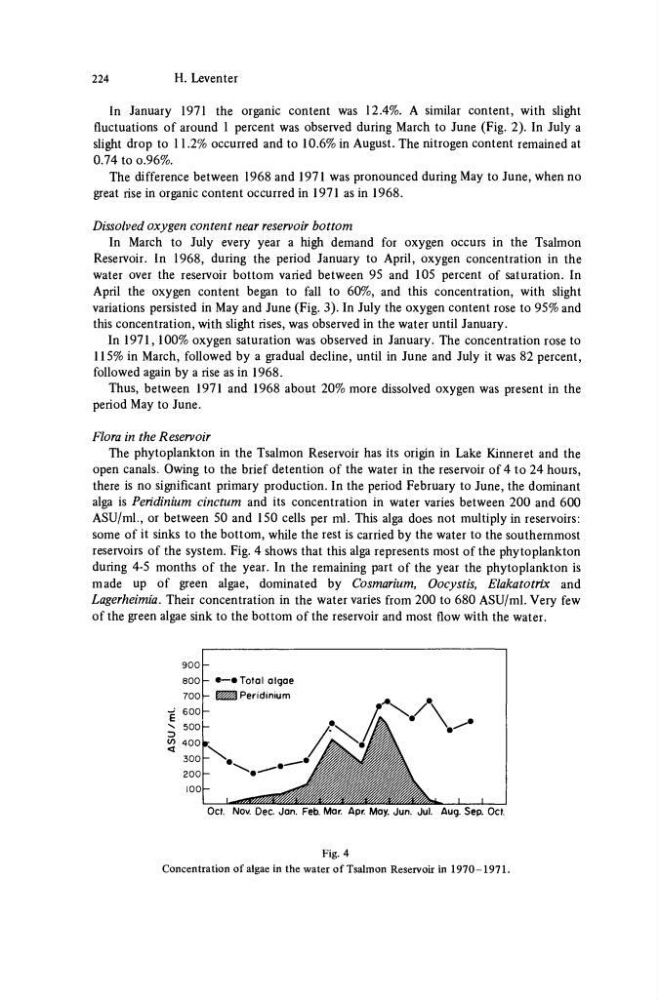
there is no significant primary production. In the period February to June, the dominant
alga is Pendinium cinctum and its concentration in water varies between 200 and 600
ASU/ml., or between 50 and 150 cells per ml. This alga does not multiply in reservoirs:
some of it sinks to the bottom, while the rest is carried by the water to the southernmost
reservoirs of the system. Fig. 4 shows that this alga represents most of the phytoplankton
during 4-5 months of the year. In the remaining part of the year the phytoplankton is
made up of green algae, dominated by Cosmarium, Oocystis, Elakatotrix and
Lagerheimia. Their concentration in the water varies from 200 to 680 ASU/ml. Very few
of the green algae sink to the bottom of the reservoir and most flow with the water.
900
800
700
-g 600
^ 500
Z>
O 4 0 0
<
300
200
100
Oct. Nov. Dec. Jan. Feb. Mar. Apr. May. Jun. Jul. Aug. Sep. Oct.
Fig. 4
Concentration of algae in the water of Tsalmon Reservoir in 1970-1971.
|- • — • T o t a l algae
Peridinium
J
L
H. Leventer
In January 1971 the organic content was 12.4%. A similar content, with slight
fluctuations of around 1 percent was observed during March to June (Fig. 2). In July a
slight drop to 11.2% occurred and to 10.6% in August. The nitrogen content remained at
0.74 to o.96%.
The difference between 1968 and 1971 was pronounced during May to June, when no
great rise in organic content occurred in 1971 as in 1968.
Dissolved oxygen content near reservoir bottom
In March to July every year a high demand for oxygen occurs in the Tsalmon
Reservoir. In 1968, during the period January to April, oxygen concentration in the
water over the reservoir bottom varied between 95 and 105 percent of saturation. In
April the oxygen content began to fall to 60%, and this concentration, with slight
variations persisted in May and June (Fig. 3). In July the oxygen content rose to 95% and
this concentration, with slight rises, was observed in the water until January.
In 1971,100% oxygen saturation was observed in January. The concentration rose to
115% in March, followed by a gradual decline, until in June and July it was 82 percent,
followed again by a rise as in 1968.
Thus, between 1971 and 1968 about 20% more dissolved oxygen was present in the
period May to June.
Flora in the Reservoir
The phytoplankton in the Tsalmon Reservoir has its origin in Lake Kinneret and the
open canals. Owing to the brief detention of the water in the reservoir of 4 to 24 hours,
there is no significant primary production. In the period February to June, the dominant
alga is Pendinium cinctum and its concentration in water varies between 200 and 600
ASU/ml., or between 50 and 150 cells per ml. This alga does not multiply in reservoirs:
some of it sinks to the bottom, while the rest is carried by the water to the southernmost
reservoirs of the system. Fig. 4 shows that this alga represents most of the phytoplankton
during 4-5 months of the year. In the remaining part of the year the phytoplankton is
made up of green algae, dominated by Cosmarium, Oocystis, Elakatotrix and
Lagerheimia. Their concentration in the water varies from 200 to 680 ASU/ml. Very few
of the green algae sink to the bottom of the reservoir and most flow with the water.
900
800
700
-g 600
^ 500
Z>
O 4 0 0
<
300
200
100
Oct. Nov. Dec. Jan. Feb. Mar. Apr. May. Jun. Jul. Aug. Sep. Oct.
Fig. 4
Concentration of algae in the water of Tsalmon Reservoir in 1970-1971.
|- • — • T o t a l algae
Peridinium
J
L