

172
C. Saliternik
THE SOURCE OF NITRATE POLLUTION
In order to arrive at an estimate of the sources of potential nitrate pollutants, a
countrywide survey was held to provide a qualitative and quantitative definition of the
pollutants. These were first located and then described according to their topographical
location. Mainly on the basis of literature survey an attempt was also made to define that
proportion of nitrogen which out of the total amount in the topsoil — is liable to move
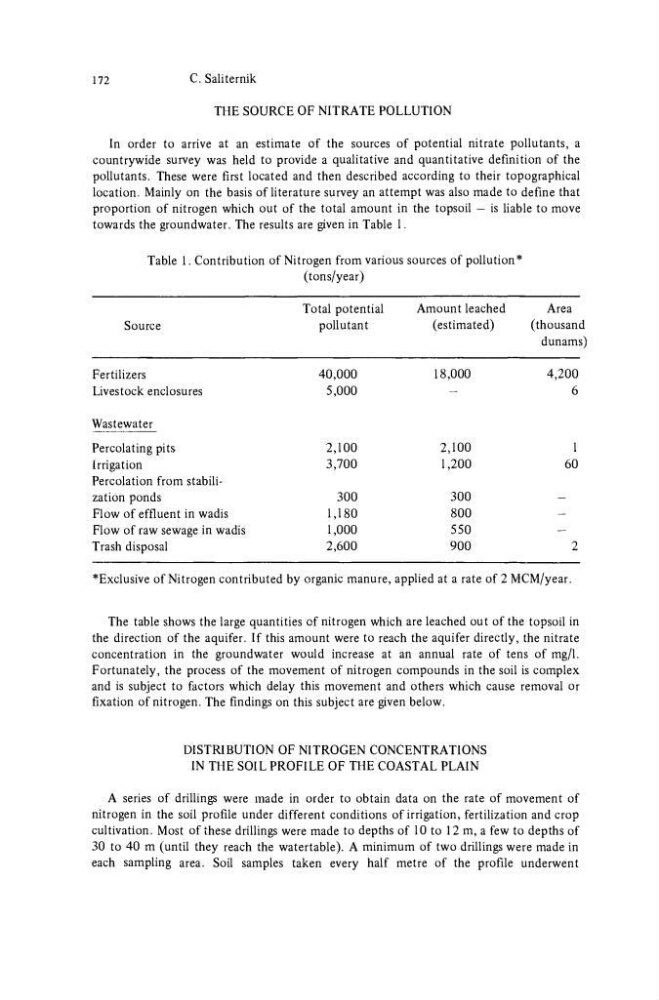
towards the groundwater. The results are given in Table 1.
Table 1. Contribution of Nitrogen from various sources of pollution*
(tons/year)
Source
Fertilizers
Livestock enclosures
Wastewater
Percolating pits
irrigation
Percolation from stabilization ponds
Flow of effluent in wadis
Flow of raw sewage in wadis
Trash disposal
Total potential
pollutant
40,000
5,000
2,100
3,700
300
1,180
1,000
2,600
Amount leached
(estimated)
18,000
—
2,100
1,200
300
800
550
900
Area
(thousand
dunams)
4,200
6
1
60
-
-
-
2
*Exclusive of Nitrogen contributed by organic manure, applied at a rate of 2 MCM/year.
The table shows the large quantities of nitrogen which are leached out of the topsoil in
the direction of the aquifer. If this amount were to reach the aquifer directly, the nitrate
concentration in the groundwater would increase at an annual rate of tens of mg/1.
Fortunately, the process of the movement of nitrogen compounds in the soil is complex
and is subject to factors which delay this movement and others which cause removal or
fixation of nitrogen. The findings on this subject are given below.
DISTRIBUTION OF NITROGEN CONCENTRATIONS
IN THE SOIL PROFILE OF THE COASTAL PLAIN
A series of drillings were made in order to obtain data on the rate of movement of
nitrogen in the soil profile under different conditions of irrigation, fertilization and crop
cultivation. Most of these drillings were made to depths of 10 to 12 m, a few to depths of
30 to 40 m (until they reach the watertable). A minimum of two drillings were made in
each sampling area. Soil samples taken every half metre of the profile underwent
C. Saliternik
THE SOURCE OF NITRATE POLLUTION
In order to arrive at an estimate of the sources of potential nitrate pollutants, a
countrywide survey was held to provide a qualitative and quantitative definition of the
pollutants. These were first located and then described according to their topographical
location. Mainly on the basis of literature survey an attempt was also made to define that
proportion of nitrogen which out of the total amount in the topsoil — is liable to move
towards the groundwater. The results are given in Table 1.
Table 1. Contribution of Nitrogen from various sources of pollution*
(tons/year)
Source
Fertilizers
Livestock enclosures
Wastewater
Percolating pits
irrigation
Percolation from stabilization ponds
Flow of effluent in wadis
Flow of raw sewage in wadis
Trash disposal
Total potential
pollutant
40,000
5,000
2,100
3,700
300
1,180
1,000
2,600
Amount leached
(estimated)
18,000
—
2,100
1,200
300
800
550
900
Area
(thousand
dunams)
4,200
6
1
60
-
-
-
2
*Exclusive of Nitrogen contributed by organic manure, applied at a rate of 2 MCM/year.
The table shows the large quantities of nitrogen which are leached out of the topsoil in
the direction of the aquifer. If this amount were to reach the aquifer directly, the nitrate
concentration in the groundwater would increase at an annual rate of tens of mg/1.
Fortunately, the process of the movement of nitrogen compounds in the soil is complex
and is subject to factors which delay this movement and others which cause removal or
fixation of nitrogen. The findings on this subject are given below.
DISTRIBUTION OF NITROGEN CONCENTRATIONS
IN THE SOIL PROFILE OF THE COASTAL PLAIN
A series of drillings were made in order to obtain data on the rate of movement of
nitrogen in the soil profile under different conditions of irrigation, fertilization and crop
cultivation. Most of these drillings were made to depths of 10 to 12 m, a few to depths of
30 to 40 m (until they reach the watertable). A minimum of two drillings were made in
each sampling area. Soil samples taken every half metre of the profile underwent