

Wind
dates results in z m / h = 0.16u* and 1 - d l h = 0.4u* (u* is in units
of mls here); this means that 1 - d l h = 2.5zm/h. The dependence of
zm and d on wind speed is rarely taken into account because it adds a
complication that is not well understood.
For uniform vegetated surfaces, such as agricultural crops, the zero
plane displacement and roughness length can be approximated by knowing just the height of the canopy. These relationships were worked out
empirically several decades ago, but were improved upon by Shaw and
Pereira (1982) using a simulation model of canopy-atmosphere interaction. By using the model they were able to investigate effects of plant
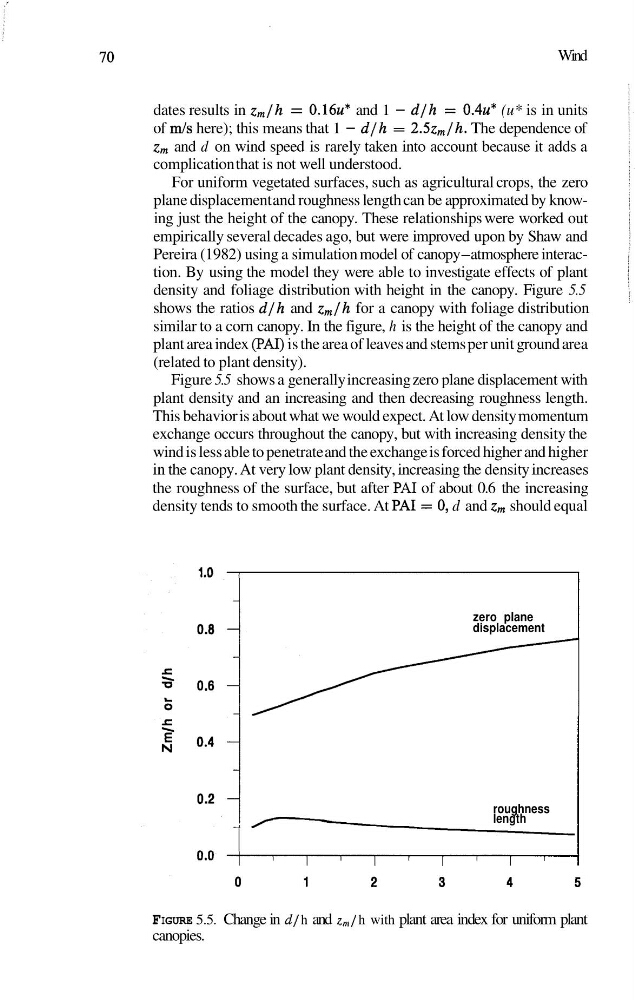
density and foliage distribution with height in the canopy. Figure 5.5
shows the ratios d l h and z,/h for a canopy with foliage distribution
similar to a corn canopy. In the figure, h is the height of the canopy and
plant area index (PAI) is the area of leaves and stems per unit ground area
(related to plant density).
Figure 5.5 shows a generally increasing zero plane displacement with
plant density and an increasing and then decreasing roughness length.
This behavior is about what we would expect. At low density momentum
exchange occurs throughout the canopy, but with increasing density the
wind is less able to penetrate and the exchange is forced higher and higher
in the canopy. At very low plant density, increasing the density increases
the roughness of the surface, but after PA1 of about 0.6 the increasing
density tends to smooth the surface. At PA1 = 0, d and z, should equal
zero plane
displacement
roughness
/
-
length
FIGURE 5.5. Change in d l h and z,/ h with plant area index for uniform plant
canopies.
dates results in z m / h = 0.16u* and 1 - d l h = 0.4u* (u* is in units
of mls here); this means that 1 - d l h = 2.5zm/h. The dependence of
zm and d on wind speed is rarely taken into account because it adds a
complication that is not well understood.
For uniform vegetated surfaces, such as agricultural crops, the zero
plane displacement and roughness length can be approximated by knowing just the height of the canopy. These relationships were worked out
empirically several decades ago, but were improved upon by Shaw and
Pereira (1982) using a simulation model of canopy-atmosphere interaction. By using the model they were able to investigate effects of plant
density and foliage distribution with height in the canopy. Figure 5.5
shows the ratios d l h and z,/h for a canopy with foliage distribution
similar to a corn canopy. In the figure, h is the height of the canopy and
plant area index (PAI) is the area of leaves and stems per unit ground area
(related to plant density).
Figure 5.5 shows a generally increasing zero plane displacement with
plant density and an increasing and then decreasing roughness length.
This behavior is about what we would expect. At low density momentum
exchange occurs throughout the canopy, but with increasing density the
wind is less able to penetrate and the exchange is forced higher and higher
in the canopy. At very low plant density, increasing the density increases
the roughness of the surface, but after PA1 of about 0.6 the increasing
density tends to smooth the surface. At PA1 = 0, d and z, should equal
zero plane
displacement
roughness
/
-
length
FIGURE 5.5. Change in d l h and z,/ h with plant area index for uniform plant
canopies.