

Modeling the Variation in Wind Speed
67
If average wind speed were measured at several heights above a soil
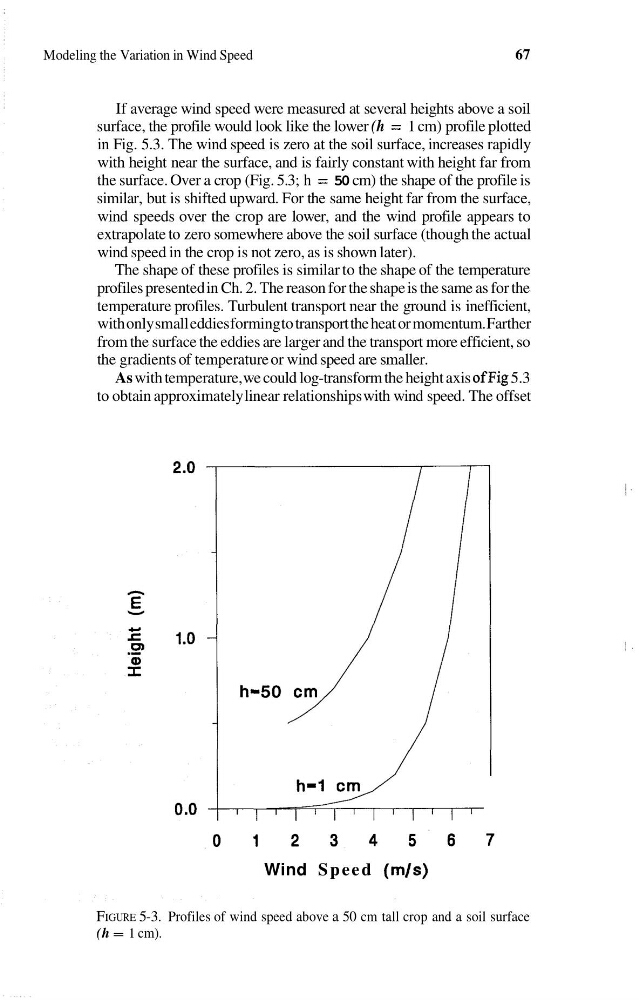
surface, the profile would look like the lower (h = 1 cm) profile plotted
in Fig. 5.3. The wind speed is zero at the soil surface, increases rapidly
with height near the surface, and is fairly constant with height far from
the surface. Over a crop (Fig. 5.3; h = 50 cm) the shape of the profile is
similar, but is shifted upward. For the same height far from the surface,
wind speeds over the crop are lower, and the wind profile appears to
extrapolate to zero somewhere above the soil surface (though the actual
wind speed in the crop is not zero, as is shown later).
The shape of these profiles is similar to the shape of the temperature
profiles presented in Ch. 2. The reason for the shape is the same as for the
temperature profiles. Turbulent transport near the ground is inefficient,
with only small eddies forming to transport the heat or momentum. Farther
from the surface the eddies are larger and the transport more efficient, so
the gradients of temperature or wind speed are smaller.
As with temperature, we could log-transform the height axis ofFig 5.3
to obtain approximately linear relationships with wind speed. The offset
Wind S p e e d (m/s)
FIGURE 5-3. Profiles of wind speed above a 50 cm tall crop and a soil surface
(h = 1 cm).
67
If average wind speed were measured at several heights above a soil
surface, the profile would look like the lower (h = 1 cm) profile plotted
in Fig. 5.3. The wind speed is zero at the soil surface, increases rapidly
with height near the surface, and is fairly constant with height far from
the surface. Over a crop (Fig. 5.3; h = 50 cm) the shape of the profile is
similar, but is shifted upward. For the same height far from the surface,
wind speeds over the crop are lower, and the wind profile appears to
extrapolate to zero somewhere above the soil surface (though the actual
wind speed in the crop is not zero, as is shown later).
The shape of these profiles is similar to the shape of the temperature
profiles presented in Ch. 2. The reason for the shape is the same as for the
temperature profiles. Turbulent transport near the ground is inefficient,
with only small eddies forming to transport the heat or momentum. Farther
from the surface the eddies are larger and the transport more efficient, so
the gradients of temperature or wind speed are smaller.
As with temperature, we could log-transform the height axis ofFig 5.3
to obtain approximately linear relationships with wind speed. The offset
Wind S p e e d (m/s)
FIGURE 5-3. Profiles of wind speed above a 50 cm tall crop and a soil surface
(h = 1 cm).