

Temperature
-20 + I I I I I I I
0
100
200
300
400
Calendar Day
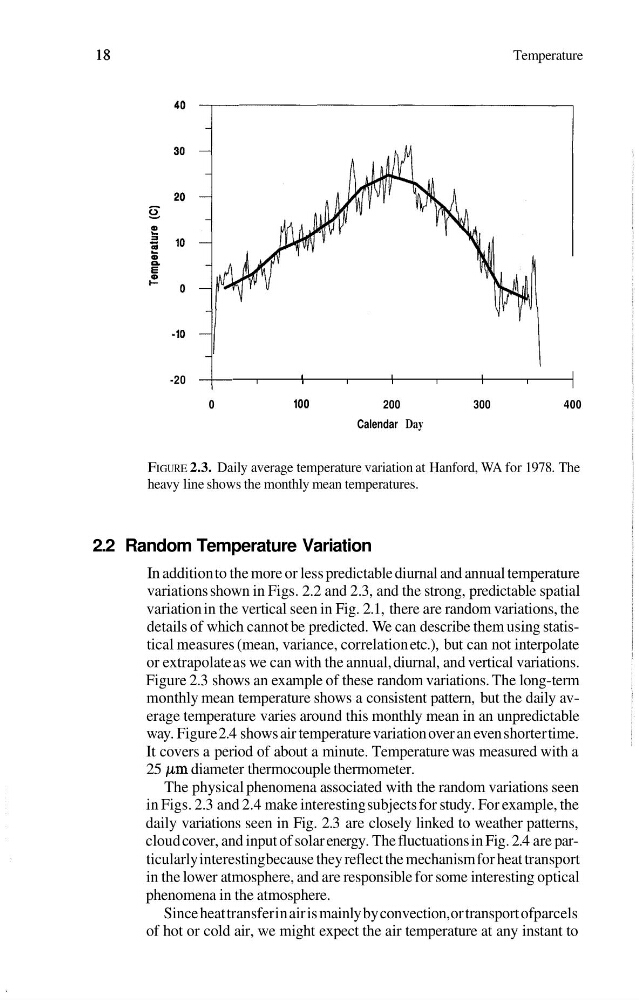
FIGURE 2.3. Daily average temperature variation at Hanford, WA for 1978. The
heavy line shows the monthly mean temperatures.
2.2 Random Temperature Variation
In addition to the more or less predictable diurnal and annual temperature
variations shown in Figs. 2.2 and 2.3, and the strong, predictable spatial
variation in the vertical seen in Fig. 2.1, there are random variations, the
details of which cannot be predicted. We can describe them using statistical measures (mean, variance, correlation etc.), but can not interpolate
or extrapolate as we can with the annual, diurnal, and vertical variations.
Figure 2.3 shows an example of these random variations. The long-term
monthly mean temperature shows a consistent pattern, but the daily average temperature varies around this monthly mean in an unpredictable
way. Figure 2.4 shows air temperature variation over an even shorter time.
It covers a period of about a minute. Temperature was measured with a
25 pm diameter thermocouple thermometer.
The physical phenomena associated with the random variations seen
in Figs. 2.3 and 2.4 make interesting subjects for study. For example, the
daily variations seen in Fig. 2.3 are closely linked to weather patterns,
cloud cover, and input of solar energy. The fluctuations in Fig. 2.4 are particularly interesting because they reflect the mechanism for heat transport
in the lower atmosphere, and are responsible for some interesting optical
phenomena in the atmosphere.
Since heat transfer in air is mainly by convection, or transport ofparcels
of hot or cold air, we might expect the air temperature at any instant to
-20 + I I I I I I I
0
100
200
300
400
Calendar Day
FIGURE 2.3. Daily average temperature variation at Hanford, WA for 1978. The
heavy line shows the monthly mean temperatures.
2.2 Random Temperature Variation
In addition to the more or less predictable diurnal and annual temperature
variations shown in Figs. 2.2 and 2.3, and the strong, predictable spatial
variation in the vertical seen in Fig. 2.1, there are random variations, the
details of which cannot be predicted. We can describe them using statistical measures (mean, variance, correlation etc.), but can not interpolate
or extrapolate as we can with the annual, diurnal, and vertical variations.
Figure 2.3 shows an example of these random variations. The long-term
monthly mean temperature shows a consistent pattern, but the daily average temperature varies around this monthly mean in an unpredictable
way. Figure 2.4 shows air temperature variation over an even shorter time.
It covers a period of about a minute. Temperature was measured with a
25 pm diameter thermocouple thermometer.
The physical phenomena associated with the random variations seen
in Figs. 2.3 and 2.4 make interesting subjects for study. For example, the
daily variations seen in Fig. 2.3 are closely linked to weather patterns,
cloud cover, and input of solar energy. The fluctuations in Fig. 2.4 are particularly interesting because they reflect the mechanism for heat transport
in the lower atmosphere, and are responsible for some interesting optical
phenomena in the atmosphere.
Since heat transfer in air is mainly by convection, or transport ofparcels
of hot or cold air, we might expect the air temperature at any instant to