

Radiation Basics
unfamiliar nature of the units to many biologists. In this presentation we
continue to use wavelength.
10.1 The Electromagnetic Spectrum
Photons in natural environments have a wide range of energies and wavelengths. The whole range ofphoton energies is called the electromagnetic
spectrum and is, somewhat arbitrarily, divided into segments or bands according to either the source of the photons or their interaction with living
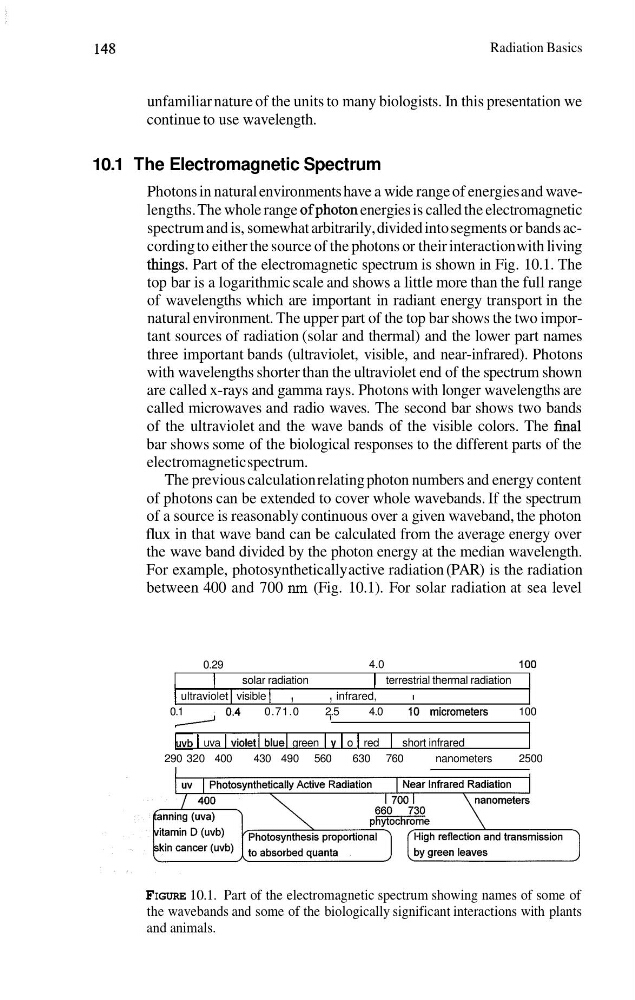
thmgs. Part of the electromagnetic spectrum is shown in Fig. 10.1. The
top bar is a logarithmic scale and shows a little more than the full range
of wavelengths which are important in radiant energy transport in the
natural environment. The upper part of the top bar shows the two important sources of radiation (solar and thermal) and the lower part names
three important bands (ultraviolet, visible, and near-infrared). Photons
with wavelengths shorter than the ultraviolet end of the spectrum shown
are called x-rays and gamma rays. Photons with longer wavelengths are
called microwaves and radio waves. The second bar shows two bands
of the ultraviolet and the wave bands of the visible colors. The h a 1
bar shows some of the biological responses to the different parts of the
electromagnetic spectrum.
The previous calculation relating photon numbers and energy content
of photons can be extended to cover whole wavebands. If the spectrum
of a source is reasonably continuous over a given waveband, the photon
flux in that wave band can be calculated from the average energy over
the wave band divided by the photon energy at the median wavelength.
For example, photosynthetically active radiation (PAR) is the radiation
between 400 and 700 nm (Fig. 10.1). For solar radiation at sea level
0.29
4.0
100
1
solar radiation
I terrestrial thermal radiation I
I ultraviolet I visible I ,
, infrared,
I
0.1
. 0 . 4
0.71.0
2.5
4.0
10micrometers
100
luvb I uva I violet] blue] green I y I o I red I short infrared
290 320 400
430 490 560
630 760
nanometers
2500
I
FIGURE 10.1. Part of the electromagnetic spectrum showing names of some of
the wavebands and some of the biologically significant interactions with plants
and animals.
unfamiliar nature of the units to many biologists. In this presentation we
continue to use wavelength.
10.1 The Electromagnetic Spectrum
Photons in natural environments have a wide range of energies and wavelengths. The whole range ofphoton energies is called the electromagnetic
spectrum and is, somewhat arbitrarily, divided into segments or bands according to either the source of the photons or their interaction with living
thmgs. Part of the electromagnetic spectrum is shown in Fig. 10.1. The
top bar is a logarithmic scale and shows a little more than the full range
of wavelengths which are important in radiant energy transport in the
natural environment. The upper part of the top bar shows the two important sources of radiation (solar and thermal) and the lower part names
three important bands (ultraviolet, visible, and near-infrared). Photons
with wavelengths shorter than the ultraviolet end of the spectrum shown
are called x-rays and gamma rays. Photons with longer wavelengths are
called microwaves and radio waves. The second bar shows two bands
of the ultraviolet and the wave bands of the visible colors. The h a 1
bar shows some of the biological responses to the different parts of the
electromagnetic spectrum.
The previous calculation relating photon numbers and energy content
of photons can be extended to cover whole wavebands. If the spectrum
of a source is reasonably continuous over a given waveband, the photon
flux in that wave band can be calculated from the average energy over
the wave band divided by the photon energy at the median wavelength.
For example, photosynthetically active radiation (PAR) is the radiation
between 400 and 700 nm (Fig. 10.1). For solar radiation at sea level
0.29
4.0
100
1
solar radiation
I terrestrial thermal radiation I
I ultraviolet I visible I ,
, infrared,
I
0.1
. 0 . 4
0.71.0
2.5
4.0
10micrometers
100
luvb I uva I violet] blue] green I y I o I red I short infrared
290 320 400
430 490 560
630 760
nanometers
2500
I
FIGURE 10.1. Part of the electromagnetic spectrum showing names of some of
the wavebands and some of the biologically significant interactions with plants
and animals.