

178
Le logiciel R - Maˆ ıtriser le langage
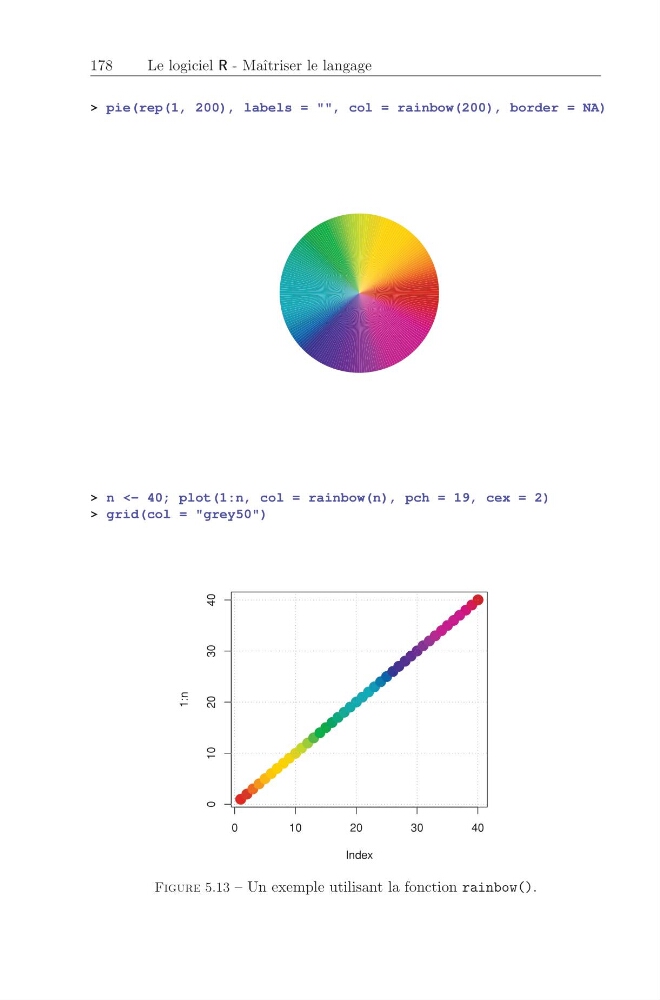
> pie(rep(1, 200), labels = "", col = rainbow(200), border = NA)
> n <- 40; plot(1:n, col = rainbow(n), pch = 19, cex = 2)
> grid(col = "grey50")
● ● ● ● ● ● ● ● ● ● ● ● ● ● ● ● ● ● ● ● ● ● ● ● ● ● ● ● ● ● ● ● ● ● ● ● ● ● ● ●
0
1 0
2 0
3 0
4 0
0
1 0
2 0
3 0
4 0
Index
1:n
Figure 5.13 – Un exemple utilisant la fonction rainbow().
Le logiciel R - Maˆ ıtriser le langage
> pie(rep(1, 200), labels = "", col = rainbow(200), border = NA)
> n <- 40; plot(1:n, col = rainbow(n), pch = 19, cex = 2)
> grid(col = "grey50")
● ● ● ● ● ● ● ● ● ● ● ● ● ● ● ● ● ● ● ● ● ● ● ● ● ● ● ● ● ● ● ● ● ● ● ● ● ● ● ●
0
1 0
2 0
3 0
4 0
0
1 0
2 0
3 0
4 0
Index
1:n
Figure 5.13 – Un exemple utilisant la fonction rainbow().