

2.2. Phenomena and Mechanism of Hydrodynamic Dispersion
21
:9
" ' -
t;::
s::
o
~-';::
o
g
!;:: - - - - . . . :g
~--..
.2
0 '------~-.~
.- - - - - . . . 0
l'
u
~- o
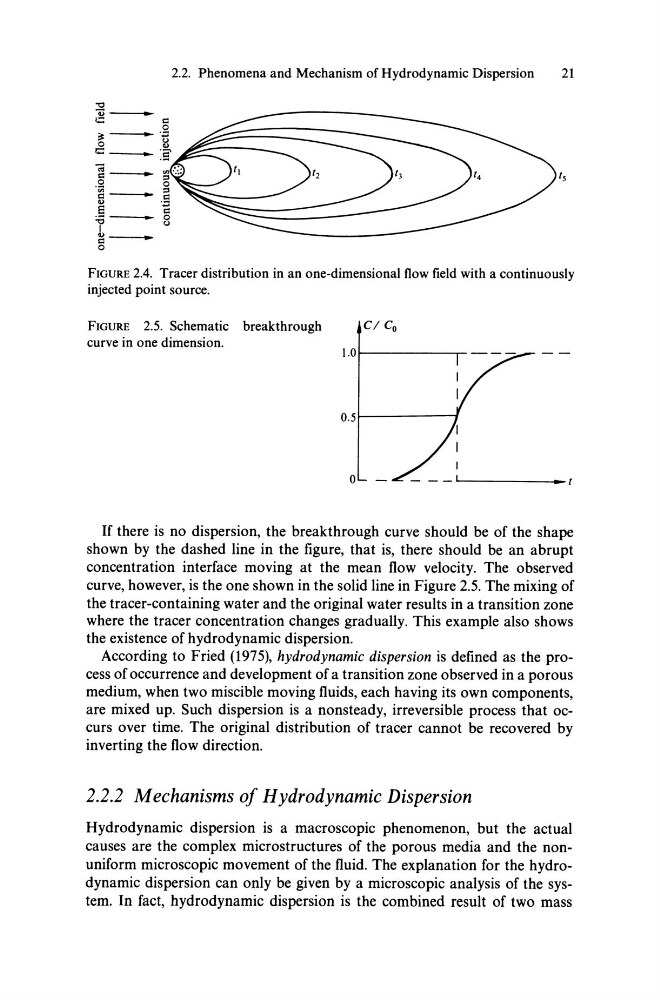
FIGURE 2.4. Tracer distribution in an one-dimensional flow field with a continuously
injected point source.
FIGURE 2.5. Schematic breakthrough
C / Co
curve in one dimension.
1.0!---------,r
0.51-------1
o
• t
If there is no dispersion, the breakthrough curve should be of the shape
shown by the dashed line in the figure, that is, there should be an abrupt
concentration interface moving at the mean flow velocity. The observed
curve, however, is the one shown in the solid li ne in Figure 2.5. The mixing of
the tracer-containing water and the original water results in a transition zone
where the tracer concentration changes gradually. This example also shows
the existence of hydrodynamic dispersion.
According to Fried (1975), hydrodynamic dispersion is defined as the process of occurrence and development of a transition zone observed in a porous
medium, when two miscible moving fluids, each having its own components,
are mixed up. Such dispersion is a nonsteady, irreversible process that occurs over time. The original distribution of tracer cannot be recovered by
inverting the flow direction.
2.2.2 Mechanisms of Hydrodynamic Dispersion
Hydrodynamic dispersion is a macroscopic phenomenon, but the actual
causes are the complex microstructures of the porous media and the nonuniform microscopic movement of the fluid. The explanation for the hydrodynamic dispersion can only be given by a microscopic analysis of the system. In fact, hydrodynamic dispersion is the combined result of two mass
21
:9
" ' -
t;::
s::
o
~-';::
o
g
!;:: - - - - . . . :g
~--..
.2
0 '------~-.~
.- - - - - . . . 0
l'
u
~- o
FIGURE 2.4. Tracer distribution in an one-dimensional flow field with a continuously
injected point source.
FIGURE 2.5. Schematic breakthrough
C / Co
curve in one dimension.
1.0!---------,r
0.51-------1
o
• t
If there is no dispersion, the breakthrough curve should be of the shape
shown by the dashed line in the figure, that is, there should be an abrupt
concentration interface moving at the mean flow velocity. The observed
curve, however, is the one shown in the solid li ne in Figure 2.5. The mixing of
the tracer-containing water and the original water results in a transition zone
where the tracer concentration changes gradually. This example also shows
the existence of hydrodynamic dispersion.
According to Fried (1975), hydrodynamic dispersion is defined as the process of occurrence and development of a transition zone observed in a porous
medium, when two miscible moving fluids, each having its own components,
are mixed up. Such dispersion is a nonsteady, irreversible process that occurs over time. The original distribution of tracer cannot be recovered by
inverting the flow direction.
2.2.2 Mechanisms of Hydrodynamic Dispersion
Hydrodynamic dispersion is a macroscopic phenomenon, but the actual
causes are the complex microstructures of the porous media and the nonuniform microscopic movement of the fluid. The explanation for the hydrodynamic dispersion can only be given by a microscopic analysis of the system. In fact, hydrodynamic dispersion is the combined result of two mass