

210
7. Mathematical Models of Groundwater Quality
MI M 2 M J M 4 M s M 6 M 7 M 8 M 9
LineM
B
Line N
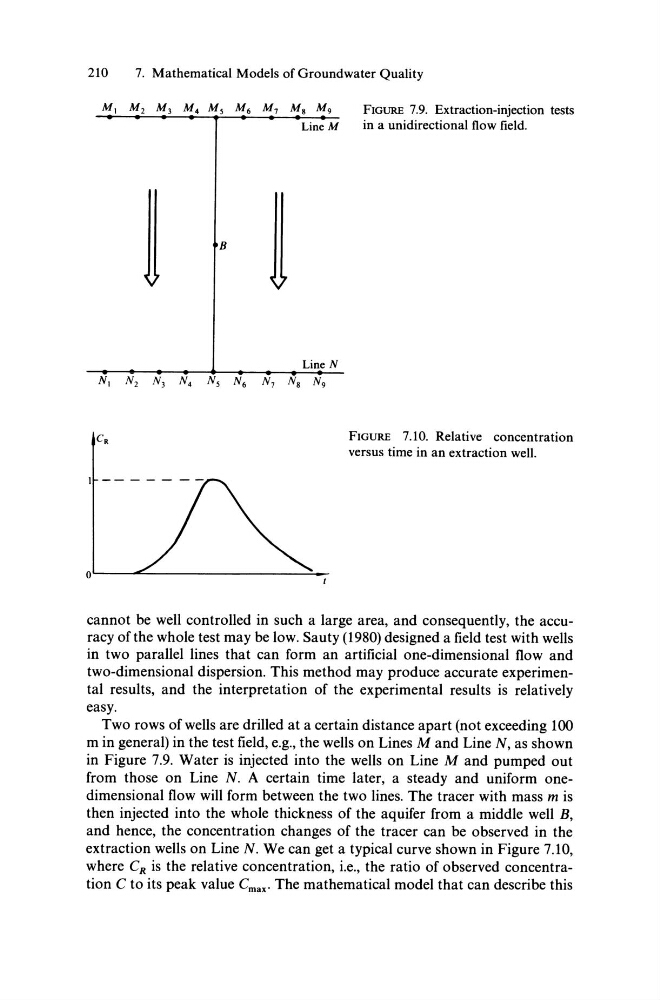
o~----~------------------~-FIGURE 7.9. Extraction-injection tests
in a unidirectional flow field.
FIGURE 7.10. Relative concentration
versus time in an extraction weil.
cannot be weIl controlled in such a large area, and consequently, the accuracy ofthe whole test may be low. Sauty (1980) designed a field test with wells
in two parallel lines that can form an artificial one-dimensional flow and
two-dimensional dispersion. This method may produce accurate experimental results, and the interpretation of the experimental results is relatively
easy.
Two rows of wells are drilled at a certain distance apart (not exceeding 100
m in general) in the test field, e.g., the wells on Lines M and Line N, as shown
in Figure 7.9. Water is injected into the wells on Line M and pumped out
from those on Line N. A certain time later, a steady and uniform onedimensional flow will form between the two lines. The tracer with mass m is
then injected into the whole thickness of the aquifer from amiddie weIl B,
and hence, the concentration changes of the tracer can be observed in the
extraction wells on Line N. We can get a typical curve shown in Figure 7.10,
where C R is the relative concentration, i.e., the ratio of observed concentration C to its peak value C rnax • The mathematical model that can describe this
7. Mathematical Models of Groundwater Quality
MI M 2 M J M 4 M s M 6 M 7 M 8 M 9
LineM
B
Line N
o~----~------------------~-FIGURE 7.9. Extraction-injection tests
in a unidirectional flow field.
FIGURE 7.10. Relative concentration
versus time in an extraction weil.
cannot be weIl controlled in such a large area, and consequently, the accuracy ofthe whole test may be low. Sauty (1980) designed a field test with wells
in two parallel lines that can form an artificial one-dimensional flow and
two-dimensional dispersion. This method may produce accurate experimental results, and the interpretation of the experimental results is relatively
easy.
Two rows of wells are drilled at a certain distance apart (not exceeding 100
m in general) in the test field, e.g., the wells on Lines M and Line N, as shown
in Figure 7.9. Water is injected into the wells on Line M and pumped out
from those on Line N. A certain time later, a steady and uniform onedimensional flow will form between the two lines. The tracer with mass m is
then injected into the whole thickness of the aquifer from amiddie weIl B,
and hence, the concentration changes of the tracer can be observed in the
extraction wells on Line N. We can get a typical curve shown in Figure 7.10,
where C R is the relative concentration, i.e., the ratio of observed concentration C to its peak value C rnax • The mathematical model that can describe this