

1 Variability of the Deepwater Horizon Surface Oil Spill Extent …
7
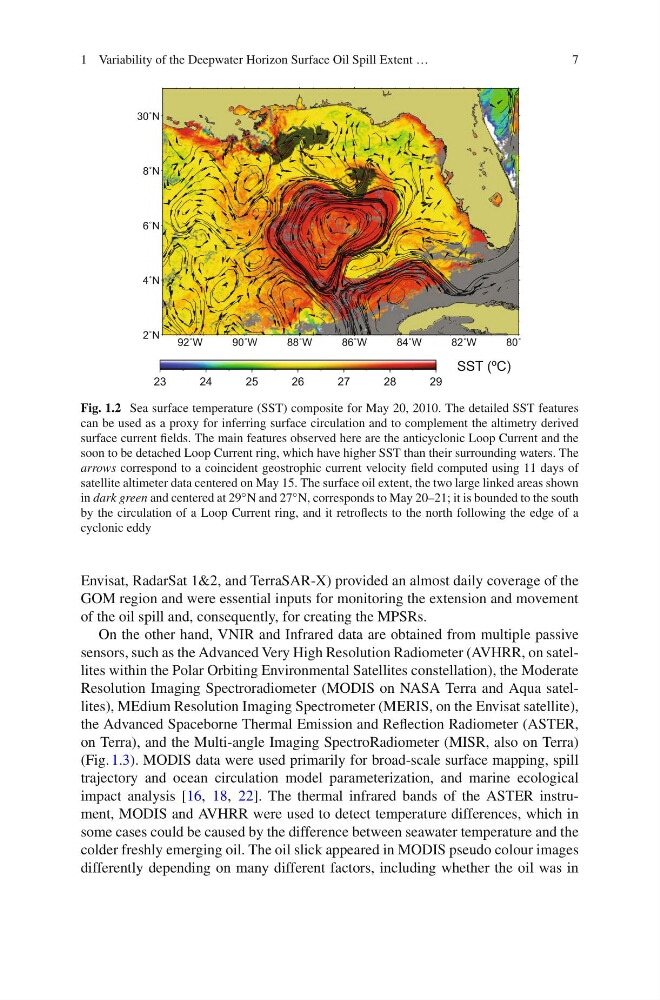
Fig. 1.2 Sea surface temperature (SST) composite for May 20, 2010. The detailed SST features
can be used as a proxy for inferring surface circulation and to complement the altimetry derived
surface current fields. The main features observed here are the anticyclonic Loop Current and the
soon to be detached Loop Current ring, which have higher SST than their surrounding waters. The
arrows correspond to a coincident geostrophic current velocity field computed using 11 days of
satellite altimeter data centered on May 15. The surface oil extent, the two large linked areas shown
in dark green and centered at 29 ◦ N and 27 ◦ N, corresponds to May 20–21; it is bounded to the south
by the circulation of a Loop Current ring, and it retroflects to the north following the edge of a
cyclonic eddy
Envisat, RadarSat 1&2, and TerraSAR-X) provided an almost daily coverage of the
GOM region and were essential inputs for monitoring the extension and movement
of the oil spill and, consequently, for creating the MPSRs.
On the other hand, VNIR and Infrared data are obtained from multiple passive
sensors, such as the Advanced Very High Resolution Radiometer (AVHRR, on satellites within the Polar Orbiting Environmental Satellites constellation), the Moderate
Resolution Imaging Spectroradiometer (MODIS on NASA Terra and Aqua satellites), MEdium Resolution Imaging Spectrometer (MERIS, on the Envisat satellite),
the Advanced Spaceborne Thermal Emission and Reflection Radiometer (ASTER,
on Terra), and the Multi-angle Imaging SpectroRadiometer (MISR, also on Terra)
(Fig. 1.3). MODIS data were used primarily for broad-scale surface mapping, spill
trajectory and ocean circulation model parameterization, and marine ecological
impact analysis [16, 18, 22]. The thermal infrared bands of the ASTER instrument, MODIS and AVHRR were used to detect temperature differences, which in
some cases could be caused by the difference between seawater temperature and the
colder freshly emerging oil. The oil slick appeared in MODIS pseudo colour images
differently depending on many different factors, including whether the oil was in
7
Fig. 1.2 Sea surface temperature (SST) composite for May 20, 2010. The detailed SST features
can be used as a proxy for inferring surface circulation and to complement the altimetry derived
surface current fields. The main features observed here are the anticyclonic Loop Current and the
soon to be detached Loop Current ring, which have higher SST than their surrounding waters. The
arrows correspond to a coincident geostrophic current velocity field computed using 11 days of
satellite altimeter data centered on May 15. The surface oil extent, the two large linked areas shown
in dark green and centered at 29 ◦ N and 27 ◦ N, corresponds to May 20–21; it is bounded to the south
by the circulation of a Loop Current ring, and it retroflects to the north following the edge of a
cyclonic eddy
Envisat, RadarSat 1&2, and TerraSAR-X) provided an almost daily coverage of the
GOM region and were essential inputs for monitoring the extension and movement
of the oil spill and, consequently, for creating the MPSRs.
On the other hand, VNIR and Infrared data are obtained from multiple passive
sensors, such as the Advanced Very High Resolution Radiometer (AVHRR, on satellites within the Polar Orbiting Environmental Satellites constellation), the Moderate
Resolution Imaging Spectroradiometer (MODIS on NASA Terra and Aqua satellites), MEdium Resolution Imaging Spectrometer (MERIS, on the Envisat satellite),
the Advanced Spaceborne Thermal Emission and Reflection Radiometer (ASTER,
on Terra), and the Multi-angle Imaging SpectroRadiometer (MISR, also on Terra)
(Fig. 1.3). MODIS data were used primarily for broad-scale surface mapping, spill
trajectory and ocean circulation model parameterization, and marine ecological
impact analysis [16, 18, 22]. The thermal infrared bands of the ASTER instrument, MODIS and AVHRR were used to detect temperature differences, which in
some cases could be caused by the difference between seawater temperature and the
colder freshly emerging oil. The oil slick appeared in MODIS pseudo colour images
differently depending on many different factors, including whether the oil was in