

118
B.R. Hodges et al.
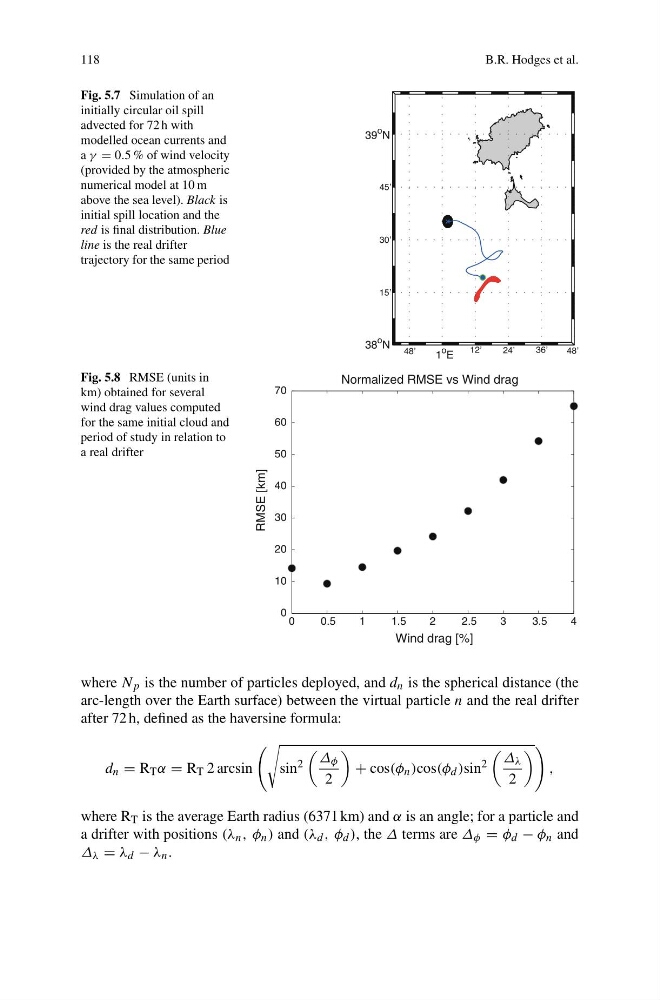
Fig. 5.7 Simulation of an
initially circular oil spill
advected for 72 h with
modelled ocean currents and
a γ = 0.5 % of wind velocity
(provided by the atmospheric
numerical model at 10 m
above the sea level). Black is
initial spill location and the
red is final distribution. Blue
line is the real drifter
trajectory for the same period
Fig. 5.8 RMSE (units in
km) obtained for several
wind drag values computed
for the same initial cloud and
period of study in relation to
a real drifter
0
0.5
1
1.5
2
2.5
3
3.5
4
0
10
20
30
40
50
60
70
RMSE [km]
Wind drag [%]
Normalized RMSE vs Wind drag
where N p is the number of particles deployed, and d n is the spherical distance (the
arc-length over the Earth surface) between the virtual particle n and the real drifter
after 72 h, defined as the haversine formula:
d n = R T α = R T 2 arcsin
sin 2
Δ φ
2
+ cos(φ n )cos(φ d )sin 2
Δ λ
2
,
where R T is the average Earth radius (6371 km) and α is an angle; for a particle and
a drifter with positions (λ n , φ n ) and (λ d , φ d ), the Δ terms are Δ φ = φ d − φ n and
Δ λ = λ d − λ n .
B.R. Hodges et al.
Fig. 5.7 Simulation of an
initially circular oil spill
advected for 72 h with
modelled ocean currents and
a γ = 0.5 % of wind velocity
(provided by the atmospheric
numerical model at 10 m
above the sea level). Black is
initial spill location and the
red is final distribution. Blue
line is the real drifter
trajectory for the same period
Fig. 5.8 RMSE (units in
km) obtained for several
wind drag values computed
for the same initial cloud and
period of study in relation to
a real drifter
0
0.5
1
1.5
2
2.5
3
3.5
4
0
10
20
30
40
50
60
70
RMSE [km]
Wind drag [%]
Normalized RMSE vs Wind drag
where N p is the number of particles deployed, and d n is the spherical distance (the
arc-length over the Earth surface) between the virtual particle n and the real drifter
after 72 h, defined as the haversine formula:
d n = R T α = R T 2 arcsin
sin 2
Δ φ
2
+ cos(φ n )cos(φ d )sin 2
Δ λ
2
,
where R T is the average Earth radius (6371 km) and α is an angle; for a particle and
a drifter with positions (λ n , φ n ) and (λ d , φ d ), the Δ terms are Δ φ = φ d − φ n and
Δ λ = λ d − λ n .