

5 Operational Oil Spill Modelling: From Science to Engineering Applications …
115
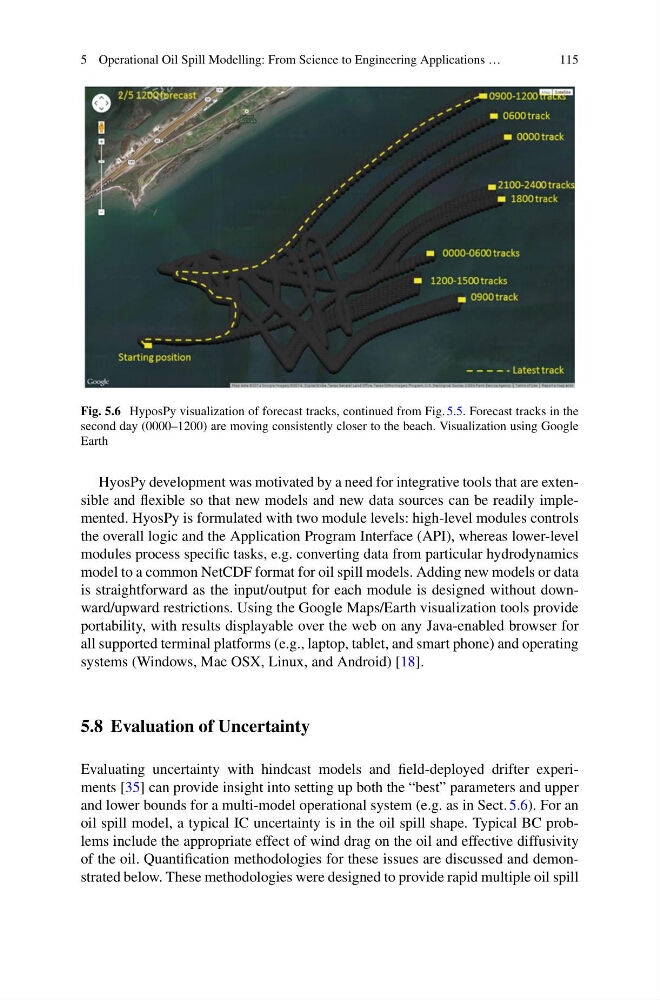
Fig. 5.6 HyposPy visualization of forecast tracks, continued from Fig. 5.5. Forecast tracks in the
second day (0000–1200) are moving consistently closer to the beach. Visualization using Google
Earth
HyosPy development was motivated by a need for integrative tools that are extensible and flexible so that new models and new data sources can be readily implemented. HyosPy is formulated with two module levels: high-level modules controls
the overall logic and the Application Program Interface (API), whereas lower-level
modules process specific tasks, e.g. converting data from particular hydrodynamics
model to a common NetCDF format for oil spill models. Adding new models or data
is straightforward as the input/output for each module is designed without downward/upward restrictions. Using the Google Maps/Earth visualization tools provide
portability, with results displayable over the web on any Java-enabled browser for
all supported terminal platforms (e.g., laptop, tablet, and smart phone) and operating
systems (Windows, Mac OSX, Linux, and Android) [18].
5.8 Evaluation of Uncertainty
Evaluating uncertainty with hindcast models and field-deployed drifter experiments [35] can provide insight into setting up both the “best” parameters and upper
and lower bounds for a multi-model operational system (e.g. as in Sect. 5.6). For an
oil spill model, a typical IC uncertainty is in the oil spill shape. Typical BC problems include the appropriate effect of wind drag on the oil and effective diffusivity
of the oil. Quantification methodologies for these issues are discussed and demonstrated below. These methodologies were designed to provide rapid multiple oil spill
115
Fig. 5.6 HyposPy visualization of forecast tracks, continued from Fig. 5.5. Forecast tracks in the
second day (0000–1200) are moving consistently closer to the beach. Visualization using Google
Earth
HyosPy development was motivated by a need for integrative tools that are extensible and flexible so that new models and new data sources can be readily implemented. HyosPy is formulated with two module levels: high-level modules controls
the overall logic and the Application Program Interface (API), whereas lower-level
modules process specific tasks, e.g. converting data from particular hydrodynamics
model to a common NetCDF format for oil spill models. Adding new models or data
is straightforward as the input/output for each module is designed without downward/upward restrictions. Using the Google Maps/Earth visualization tools provide
portability, with results displayable over the web on any Java-enabled browser for
all supported terminal platforms (e.g., laptop, tablet, and smart phone) and operating
systems (Windows, Mac OSX, Linux, and Android) [18].
5.8 Evaluation of Uncertainty
Evaluating uncertainty with hindcast models and field-deployed drifter experiments [35] can provide insight into setting up both the “best” parameters and upper
and lower bounds for a multi-model operational system (e.g. as in Sect. 5.6). For an
oil spill model, a typical IC uncertainty is in the oil spill shape. Typical BC problems include the appropriate effect of wind drag on the oil and effective diffusivity
of the oil. Quantification methodologies for these issues are discussed and demonstrated below. These methodologies were designed to provide rapid multiple oil spill