

303
189 1
16-9"
181)4
'f I I I I I I
o_ ~~ •• o
\
\
\
,]~
. \, ~
Ol.-_ _ _ ...:,...._~=_----1. ,1 7 m
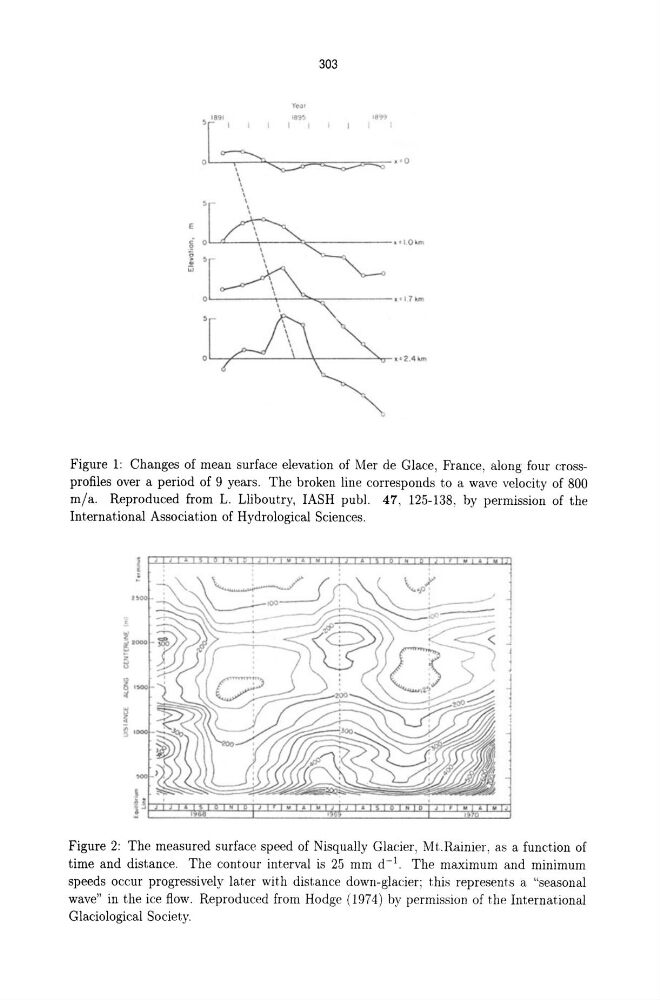
Figure 1: Changes of mean surface elevation of Mer de Glace, France, along four crossprofiles over a period of 9 years. The broken line corresponds to a wave velocity of 800
m/ a. Reproduced from L. Lliboutry, lASH pubJ. 47, 125-138, by permission of the
International Association of Hydrological Sciences.
i ' ,
~
2>00
J
•
J
J
Figure 2: The measured surface speed of Nisqually Glacier, Mt. Rainier, as a function of
time and distance. The contour interval is 25 mm d- 1 The maximum and minimum
speeds occur progressively later with distance down-glacier; this represents a "seasonal
wave" in the ice flow. Reproduced from Hodge (974) by permission of t he International
Glaciological Society.
189 1
16-9"
181)4
'f I I I I I I
o_ ~~ •• o
\
\
\
,]~
. \, ~
Ol.-_ _ _ ...:,...._~=_----1. ,1 7 m
Figure 1: Changes of mean surface elevation of Mer de Glace, France, along four crossprofiles over a period of 9 years. The broken line corresponds to a wave velocity of 800
m/ a. Reproduced from L. Lliboutry, lASH pubJ. 47, 125-138, by permission of the
International Association of Hydrological Sciences.
i ' ,
~
2>00
J
•
J
J
Figure 2: The measured surface speed of Nisqually Glacier, Mt. Rainier, as a function of
time and distance. The contour interval is 25 mm d- 1 The maximum and minimum
speeds occur progressively later with distance down-glacier; this represents a "seasonal
wave" in the ice flow. Reproduced from Hodge (974) by permission of t he International
Glaciological Society.