

118
U.S. (denoted with AMI, AM2, and AM3 in Table 1) and two sets of experiments were
performed. In the first (CONTROL experiment), BATS was run as a single grid point
using the dominant vegetation type and in the second (SUBVEG experiment) a subgrid of
36 points was defined for each region, with each subgrid point characterized by a different
VBATS vegetation type (specified from a half degree dataset). An idealized experiment
was also performed in which 51 % of the area was covered by forest and 49% by grass. This
experiment was designed to maximize the possible error arising from using the dominant
type, since forest and grass in BATS showed the largest differences in response to the
same climate forcing.
The model was forced by an observed annual climatology assembled for the region at
an half/hourly time step. This climatology included storm cycles of 7 day period for the
cold season and daily period for the warm season. VBATS experiments were carried out
in which climate was not redistributed throughout the fine mesh (i.e. each sub-grid box
was forced by the same climate), and in which the precipitation was spatially redistributed
according to a Gaussian distribution in the cold season and to a random distribution (over
30% of the sub-grid points) in the warm season.
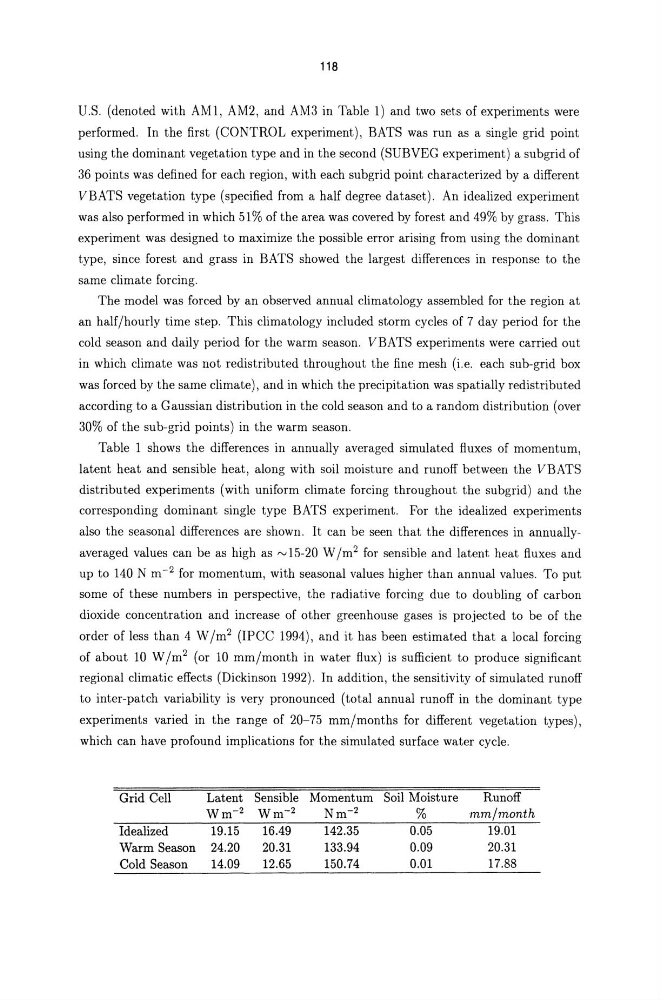
Table 1 shows the differences in annually averaged simulated fluxes of momentum,
latent heat and sensible heat, along with soil moisture and runoff between the VBATS
distributed experiments (with uniform climate forcing throughout the subgrid) and the
corresponding dominant single type BATS experiment. For the idealized experiments
also the seasonal differences are shown. It can be seen that the differences in annuallyaveraged values can be as high as rv 15-20 W /m 2 for sensible and latent heat fluxes and
up to 140 N m- 2 for momentum, with seasonal values higher than annual values. To put
some of these numbers in perspective, the radiative forcing due to doubling of carbon
dioxide concentration and increase of other greenhouse gases is projected to be of the
order of less than 4 W /m 2 (IPCC 1994), and it has been estimated that a local forcing
of about 10 W /m 2 (or 10 mm/month in water flux) is sufficient to produce significant
regional climatic effects (Dickinson 1992). In addition, the sensitivity of simulated runoff
to inter-patch variability is very pronounced (total annual runoff in the dominant type
experiments varied in the range of 20-75 mm/months for different vegetation types),
which can have profound implications for the simulated surface water cycle.
Grid Cell
Latent Sensible Momentum Soil Moisture
Runoff
Wm- 2 Wm- 2
Nm- 2
%
mm/month
Idealized
19.15
16.49
142.35
0.05
19.01
Warm Season 24.20
20.31
133.94
0.09
20.31
Cold Season
14.09
12.65
150.74
0.01
17.88
U.S. (denoted with AMI, AM2, and AM3 in Table 1) and two sets of experiments were
performed. In the first (CONTROL experiment), BATS was run as a single grid point
using the dominant vegetation type and in the second (SUBVEG experiment) a subgrid of
36 points was defined for each region, with each subgrid point characterized by a different
VBATS vegetation type (specified from a half degree dataset). An idealized experiment
was also performed in which 51 % of the area was covered by forest and 49% by grass. This
experiment was designed to maximize the possible error arising from using the dominant
type, since forest and grass in BATS showed the largest differences in response to the
same climate forcing.
The model was forced by an observed annual climatology assembled for the region at
an half/hourly time step. This climatology included storm cycles of 7 day period for the
cold season and daily period for the warm season. VBATS experiments were carried out
in which climate was not redistributed throughout the fine mesh (i.e. each sub-grid box
was forced by the same climate), and in which the precipitation was spatially redistributed
according to a Gaussian distribution in the cold season and to a random distribution (over
30% of the sub-grid points) in the warm season.
Table 1 shows the differences in annually averaged simulated fluxes of momentum,
latent heat and sensible heat, along with soil moisture and runoff between the VBATS
distributed experiments (with uniform climate forcing throughout the subgrid) and the
corresponding dominant single type BATS experiment. For the idealized experiments
also the seasonal differences are shown. It can be seen that the differences in annuallyaveraged values can be as high as rv 15-20 W /m 2 for sensible and latent heat fluxes and
up to 140 N m- 2 for momentum, with seasonal values higher than annual values. To put
some of these numbers in perspective, the radiative forcing due to doubling of carbon
dioxide concentration and increase of other greenhouse gases is projected to be of the
order of less than 4 W /m 2 (IPCC 1994), and it has been estimated that a local forcing
of about 10 W /m 2 (or 10 mm/month in water flux) is sufficient to produce significant
regional climatic effects (Dickinson 1992). In addition, the sensitivity of simulated runoff
to inter-patch variability is very pronounced (total annual runoff in the dominant type
experiments varied in the range of 20-75 mm/months for different vegetation types),
which can have profound implications for the simulated surface water cycle.
Grid Cell
Latent Sensible Momentum Soil Moisture
Runoff
Wm- 2 Wm- 2
Nm- 2
%
mm/month
Idealized
19.15
16.49
142.35
0.05
19.01
Warm Season 24.20
20.31
133.94
0.09
20.31
Cold Season
14.09
12.65
150.74
0.01
17.88