

The Great Barrier Reef
20
(A)
(C)
(B)
(D)
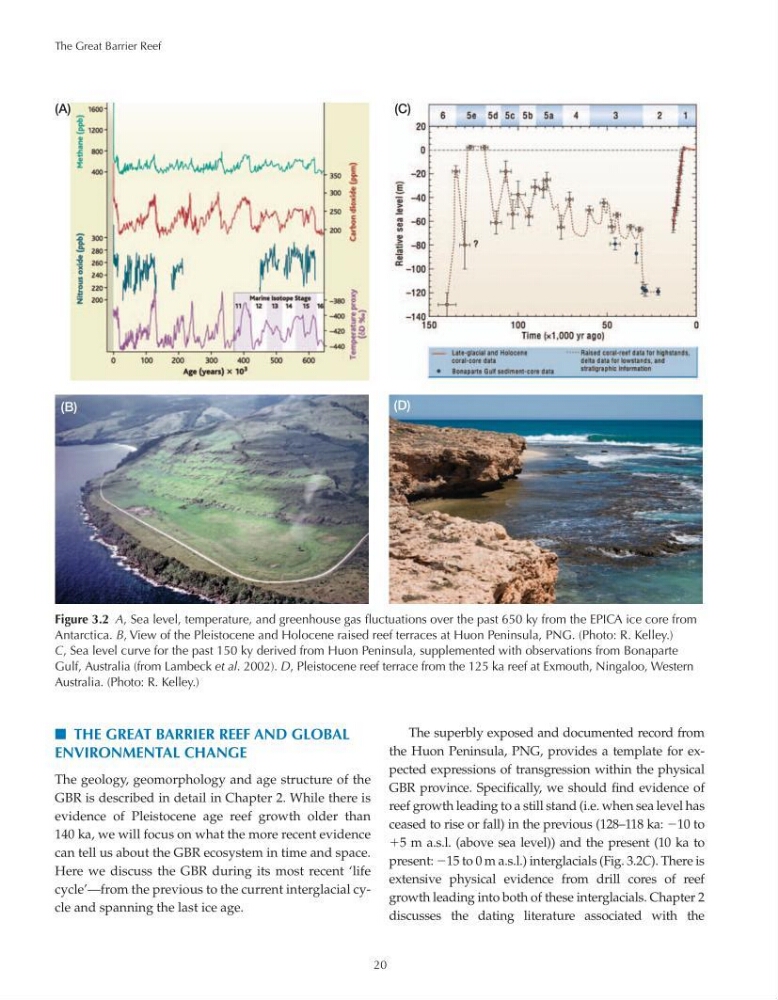
Figure 3.2 A, Sea level, temperature, and greenhouse gas fluctuations over the past 650 ky from the EPICA ice core from
Antarctica. B, View of the Pleistocene and Holocene raised reef terraces at Huon Peninsula, PNG. (Photo: R. Kelley.)
C, Sea level curve for the past 150 ky derived from Huon Peninsula, supplemented with observations from Bonaparte
Gulf, Australia (from Lambeck et al. 2002). D, Pleistocene reef terrace from the 125 ka reef at Exmouth, Ningaloo, Western
Australia. (Photo: R. Kelley.)
N THE GREAT BARRIER REEF AND GLOBAL
ENVIRONMENTAL CHANGE
The geology, geomorphology and age structure of the
GBR is described in detail in Chapter 2. While there is
evidence of Pleistocene age reef growth older than
140 ka, we will focus on what the more recent evidence
can tell us about the GBR ecosystem in time and space.
Here we discuss the GBR during its most recent ‘life
cycle’—from the previous to the current interglacial cycle and spanning the last ice age.
The superbly exposed and documented record from
the Huon Peninsula, PNG, provides a template for expected expressions of transgression within the physical
GBR province. Specifically, we should find evidence of
reef growth leading to a still stand (i.e. when sea level has
ceased to rise or fall) in the previous (128–118 ka: 10 to
5 m a.s.l. (above sea level)) and the present (10 ka to
present: 15 to 0 m a.s.l.) interglacials (Fig. 3.2C). There is
extensive physical evidence from drill cores of reef
growth leading into both of these interglacials. Chapter 2
discusses the dating literature associated with the
20
(A)
(C)
(B)
(D)
Figure 3.2 A, Sea level, temperature, and greenhouse gas fluctuations over the past 650 ky from the EPICA ice core from
Antarctica. B, View of the Pleistocene and Holocene raised reef terraces at Huon Peninsula, PNG. (Photo: R. Kelley.)
C, Sea level curve for the past 150 ky derived from Huon Peninsula, supplemented with observations from Bonaparte
Gulf, Australia (from Lambeck et al. 2002). D, Pleistocene reef terrace from the 125 ka reef at Exmouth, Ningaloo, Western
Australia. (Photo: R. Kelley.)
N THE GREAT BARRIER REEF AND GLOBAL
ENVIRONMENTAL CHANGE
The geology, geomorphology and age structure of the
GBR is described in detail in Chapter 2. While there is
evidence of Pleistocene age reef growth older than
140 ka, we will focus on what the more recent evidence
can tell us about the GBR ecosystem in time and space.
Here we discuss the GBR during its most recent ‘life
cycle’—from the previous to the current interglacial cycle and spanning the last ice age.
The superbly exposed and documented record from
the Huon Peninsula, PNG, provides a template for expected expressions of transgression within the physical
GBR province. Specifically, we should find evidence of
reef growth leading to a still stand (i.e. when sea level has
ceased to rise or fall) in the previous (128–118 ka: 10 to
5 m a.s.l. (above sea level)) and the present (10 ka to
present: 15 to 0 m a.s.l.) interglacials (Fig. 3.2C). There is
extensive physical evidence from drill cores of reef
growth leading into both of these interglacials. Chapter 2
discusses the dating literature associated with the