

The Great Barrier Reef
98
techniques have been used on tree rings, lake sediments
and ice cores to derive long term perspectives on how
the Earth’s temperature (and other key factors) has varied over thousands to tens of millions of years.
Ice cores also provide an important historic context
for the recent dramatic changes in the concentration of
key gases like CO 2 . In some regions, precipitation has
accumulated as ice that has not thawed for hundreds of
thousands of years, providing an uninterrupted record
of the ice deposits and their composition over time. The
ice also contains small amounts of atmospheric gas
trapped as bubbles in the frozen sediments. Climate scientists have drilled long cores from places such as the
Vostok Station (operated by Russia) in Antarctica and
analysed the bubbles. Isotopic dating has provided precise dates for when these gas concentrations occurred.
Other methods allow scientists to calculate the average
temperature of the planet and the total ice volume on
Earth at any particular date. Dust trapped in the ice layers can give important information on the amount of
volcanic activity at the time of ice deposition.
Several ice cores extend our detailed understanding
of the variability of the global climate back to at least
720 000 years ago. The information generated by these
cores has highlighted the unprecedented changes that
humans are currently inflicting on the planet. The
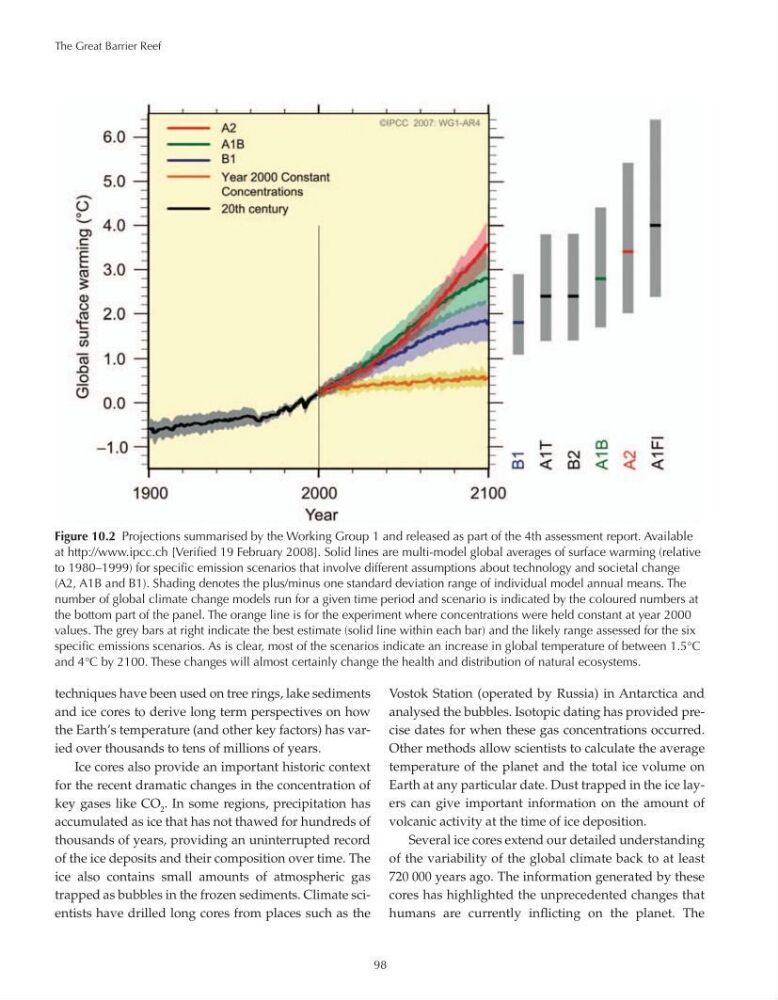
Figure 10.2 Projections summarised by the Working Group 1 and released as part of the 4th assessment report. Available
at http://www.ipcc.ch [Verified 19 February 2008]. Solid lines are multi-model global averages of surface warming (relative
to 1980–1999) for specific emission scenarios that involve different assumptions about technology and societal change
(A2, A1B and B1). Shading denotes the plus/minus one standard deviation range of individual model annual means. The
number of global climate change models run for a given time period and scenario is indicated by the coloured numbers at
the bottom part of the panel. The orange line is for the experiment where concentrations were held constant at year 2000
values. The grey bars at right indicate the best estimate (solid line within each bar) and the likely range assessed for the six
specific emissions scenarios. As is clear, most of the scenarios indicate an increase in global temperature of between 1.5°C
and 4°C by 2100. These changes will almost certainly change the health and distribution of natural ecosystems.
98
techniques have been used on tree rings, lake sediments
and ice cores to derive long term perspectives on how
the Earth’s temperature (and other key factors) has varied over thousands to tens of millions of years.
Ice cores also provide an important historic context
for the recent dramatic changes in the concentration of
key gases like CO 2 . In some regions, precipitation has
accumulated as ice that has not thawed for hundreds of
thousands of years, providing an uninterrupted record
of the ice deposits and their composition over time. The
ice also contains small amounts of atmospheric gas
trapped as bubbles in the frozen sediments. Climate scientists have drilled long cores from places such as the
Vostok Station (operated by Russia) in Antarctica and
analysed the bubbles. Isotopic dating has provided precise dates for when these gas concentrations occurred.
Other methods allow scientists to calculate the average
temperature of the planet and the total ice volume on
Earth at any particular date. Dust trapped in the ice layers can give important information on the amount of
volcanic activity at the time of ice deposition.
Several ice cores extend our detailed understanding
of the variability of the global climate back to at least
720 000 years ago. The information generated by these
cores has highlighted the unprecedented changes that
humans are currently inflicting on the planet. The
Figure 10.2 Projections summarised by the Working Group 1 and released as part of the 4th assessment report. Available
at http://www.ipcc.ch [Verified 19 February 2008]. Solid lines are multi-model global averages of surface warming (relative
to 1980–1999) for specific emission scenarios that involve different assumptions about technology and societal change
(A2, A1B and B1). Shading denotes the plus/minus one standard deviation range of individual model annual means. The
number of global climate change models run for a given time period and scenario is indicated by the coloured numbers at
the bottom part of the panel. The orange line is for the experiment where concentrations were held constant at year 2000
values. The grey bars at right indicate the best estimate (solid line within each bar) and the likely range assessed for the six
specific emissions scenarios. As is clear, most of the scenarios indicate an increase in global temperature of between 1.5°C
and 4°C by 2100. These changes will almost certainly change the health and distribution of natural ecosystems.