

192 Organic compounds in soils, sediments & sludges
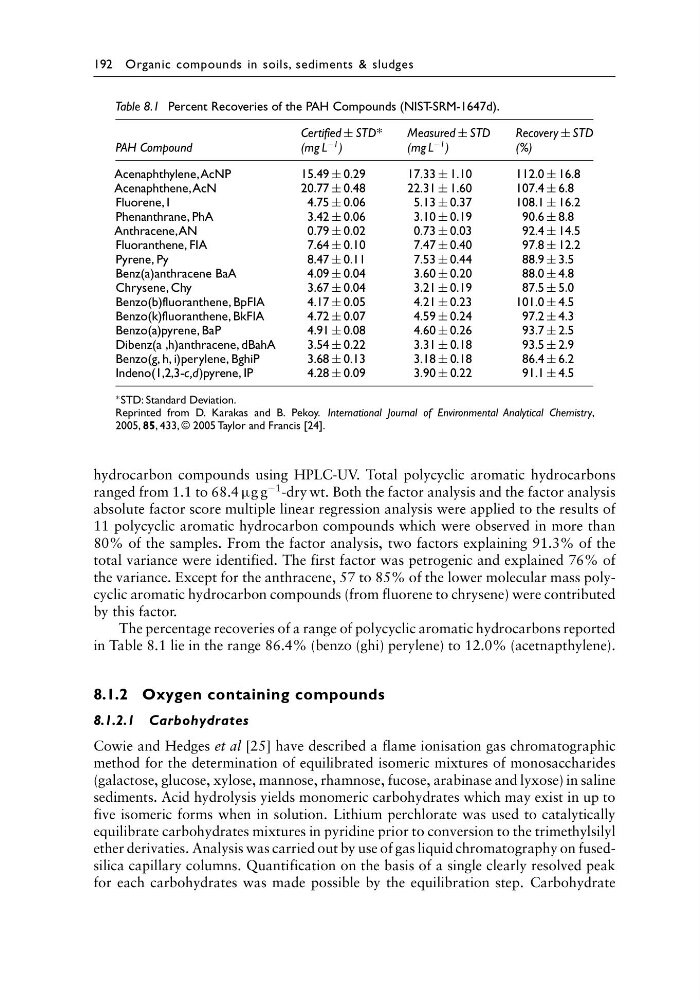
Table 8.1 Percent Recoveries of the PAH Compounds (NIST-SRM-1647d).
Certified ± STD*
Measured ± STD
Recovery ± STD
PAH Compound
(mg L
−1 )
(mg L
−1 )
(%)
Acenaphthylene,AcNP
15.49 ± 0.29
17.33 ± 1.10
112.0 ± 16.8
Acenaphthene,AcN
20.77 ± 0.48
22.31 ± 1.60
107.4 ± 6.8
Fluorene, I
4.75 ± 0.06
5.13 ± 0.37
108.1 ± 16.2
Phenanthrane, PhA
3.42 ± 0.06
3.10 ± 0.19
90.6 ± 8.8
Anthracene,AN
0.79 ± 0.02
0.73 ± 0.03
92.4 ± 14.5
Fluoranthene, FIA
7.64 ± 0.10
7.47 ± 0.40
97.8 ± 12.2
Pyrene, Py
8.47 ± 0.11
7.53 ± 0.44
88.9 ± 3.5
Benz(a)anthracene BaA
4.09 ± 0.04
3.60 ± 0.20
88.0 ± 4.8
Chrysene, Chy
3.67 ± 0.04
3.21 ± 0.19
87.5 ± 5.0
Benzo(b)fluoranthene, BpFIA
4.17 ± 0.05
4.21 ± 0.23
101.0 ± 4.5
Benzo(k)fluoranthene, BkFIA
4.72 ± 0.07
4.59 ± 0.24
97.2 ± 4.3
Benzo(a)pyrene, BaP
4.91 ± 0.08
4.60 ± 0.26
93.7 ± 2.5
Dibenz(a ,h)anthracene, dBahA
3.54 ± 0.22
3.31 ± 0.18
93.5 ± 2.9
Benzo(g, h, i)perylene, BghiP
3.68 ± 0.13
3.18 ± 0.18
86.4 ± 6.2
Indeno(1,2,3-c,d)pyrene, IP
4.28 ± 0.09
3.90 ± 0.22
91.1 ± 4.5
∗ STD: Standard Deviation.
Reprinted from D. Karakas and B. Pekoy. International Journal of Environmental Analytical Chemistry,
2005, 85, 433, © 2005 Taylor and Francis [24].
hydrocarbon compounds using HPLC-UV. Total polycyclic aromatic hydrocarbons
ranged from 1.1 to 68.4 µg g
−1 -dry wt. Both the factor analysis and the factor analysis
absolute factor score multiple linear regression analysis were applied to the results of
11 polycyclic aromatic hydrocarbon compounds which were observed in more than
80% of the samples. From the factor analysis, two factors explaining 91.3% of the
total variance were identified. The first factor was petrogenic and explained 76% of
the variance. Except for the anthracene, 57 to 85% of the lower molecular mass polycyclic aromatic hydrocarbon compounds (from fluorene to chrysene) were contributed
by this factor.
The percentage recoveries of a range of polycyclic aromatic hydrocarbons reported
in Table 8.1 lie in the range 86.4% (benzo (ghi) perylene) to 12.0% (acetnapthylene).
8.1.2 Oxygen containing compounds
8.1.2.1 Carbohydrates
Cowie and Hedges et al [25] have described a flame ionisation gas chromatographic
method for the determination of equilibrated isomeric mixtures of monosaccharides
(galactose, glucose, xylose, mannose, rhamnose, fucose, arabinase and lyxose) in saline
sediments. Acid hydrolysis yields monomeric carbohydrates which may exist in up to
five isomeric forms when in solution. Lithium perchlorate was used to catalytically
equilibrate carbohydrates mixtures in pyridine prior to conversion to the trimethylsilyl
ether derivaties. Analysis was carried out by use of gas liquid chromatography on fusedsilica capillary columns. Quantification on the basis of a single clearly resolved peak
for each carbohydrates was made possible by the equilibration step. Carbohydrate
Table 8.1 Percent Recoveries of the PAH Compounds (NIST-SRM-1647d).
Certified ± STD*
Measured ± STD
Recovery ± STD
PAH Compound
(mg L
−1 )
(mg L
−1 )
(%)
Acenaphthylene,AcNP
15.49 ± 0.29
17.33 ± 1.10
112.0 ± 16.8
Acenaphthene,AcN
20.77 ± 0.48
22.31 ± 1.60
107.4 ± 6.8
Fluorene, I
4.75 ± 0.06
5.13 ± 0.37
108.1 ± 16.2
Phenanthrane, PhA
3.42 ± 0.06
3.10 ± 0.19
90.6 ± 8.8
Anthracene,AN
0.79 ± 0.02
0.73 ± 0.03
92.4 ± 14.5
Fluoranthene, FIA
7.64 ± 0.10
7.47 ± 0.40
97.8 ± 12.2
Pyrene, Py
8.47 ± 0.11
7.53 ± 0.44
88.9 ± 3.5
Benz(a)anthracene BaA
4.09 ± 0.04
3.60 ± 0.20
88.0 ± 4.8
Chrysene, Chy
3.67 ± 0.04
3.21 ± 0.19
87.5 ± 5.0
Benzo(b)fluoranthene, BpFIA
4.17 ± 0.05
4.21 ± 0.23
101.0 ± 4.5
Benzo(k)fluoranthene, BkFIA
4.72 ± 0.07
4.59 ± 0.24
97.2 ± 4.3
Benzo(a)pyrene, BaP
4.91 ± 0.08
4.60 ± 0.26
93.7 ± 2.5
Dibenz(a ,h)anthracene, dBahA
3.54 ± 0.22
3.31 ± 0.18
93.5 ± 2.9
Benzo(g, h, i)perylene, BghiP
3.68 ± 0.13
3.18 ± 0.18
86.4 ± 6.2
Indeno(1,2,3-c,d)pyrene, IP
4.28 ± 0.09
3.90 ± 0.22
91.1 ± 4.5
∗ STD: Standard Deviation.
Reprinted from D. Karakas and B. Pekoy. International Journal of Environmental Analytical Chemistry,
2005, 85, 433, © 2005 Taylor and Francis [24].
hydrocarbon compounds using HPLC-UV. Total polycyclic aromatic hydrocarbons
ranged from 1.1 to 68.4 µg g
−1 -dry wt. Both the factor analysis and the factor analysis
absolute factor score multiple linear regression analysis were applied to the results of
11 polycyclic aromatic hydrocarbon compounds which were observed in more than
80% of the samples. From the factor analysis, two factors explaining 91.3% of the
total variance were identified. The first factor was petrogenic and explained 76% of
the variance. Except for the anthracene, 57 to 85% of the lower molecular mass polycyclic aromatic hydrocarbon compounds (from fluorene to chrysene) were contributed
by this factor.
The percentage recoveries of a range of polycyclic aromatic hydrocarbons reported
in Table 8.1 lie in the range 86.4% (benzo (ghi) perylene) to 12.0% (acetnapthylene).
8.1.2 Oxygen containing compounds
8.1.2.1 Carbohydrates
Cowie and Hedges et al [25] have described a flame ionisation gas chromatographic
method for the determination of equilibrated isomeric mixtures of monosaccharides
(galactose, glucose, xylose, mannose, rhamnose, fucose, arabinase and lyxose) in saline
sediments. Acid hydrolysis yields monomeric carbohydrates which may exist in up to
five isomeric forms when in solution. Lithium perchlorate was used to catalytically
equilibrate carbohydrates mixtures in pyridine prior to conversion to the trimethylsilyl
ether derivaties. Analysis was carried out by use of gas liquid chromatography on fusedsilica capillary columns. Quantification on the basis of a single clearly resolved peak
for each carbohydrates was made possible by the equilibration step. Carbohydrate