

2.3 EXAMPLES OF ENVIRONMENTAL DISEASES
2.3.1 INTRODUCTION
Many diseases have long been recognized as being related to occupation. The
British doctor Percivall Pott is widely recognized as being the scientist who, in
1775, first pointed out the direct connection between an occupational exposure
and the risk of a specific cancer, i.e., chimney sweeps and cancer of the
scrotum.
17 Miners, stone cutters, and lens grinders often developed respiratory
disease from inhaling large quantities of dust. Many hatters suffered brain
damage as a result of absorbing highly toxic vapors from mercurials (chemical
compounds containing mercury) used in making felt. Asphalt, coal tar and
pitch workers, textile dyers, and shoe and leather workers are all suspected of
having an increased risk of developing bladder cancer because of their
association with coal products and aromatic amines.
However, in the past several decades, environmental diseases have spread
beyond those employed in a few specialized occupations.
18 Among the most
serious are cancer, respiratory diseases, birth defects, heavy-metal poisoning,
and injury to the reproductive system. These are briefly discussed in this
chapter, and are covered in more detail in subsequent chapters.
2.3.2 CANCER
Many researchers recognize that a close association exists between industrial
activities and cancer incidences and cancer death rates. The U.S. has one of the
world’s highest incidences of cancer associated with environmental pollution.
Since about 1950, cancer has been second only to heart disease as the cause of
death in the U.S. Moreover, until recently the rate of cancer deaths had been
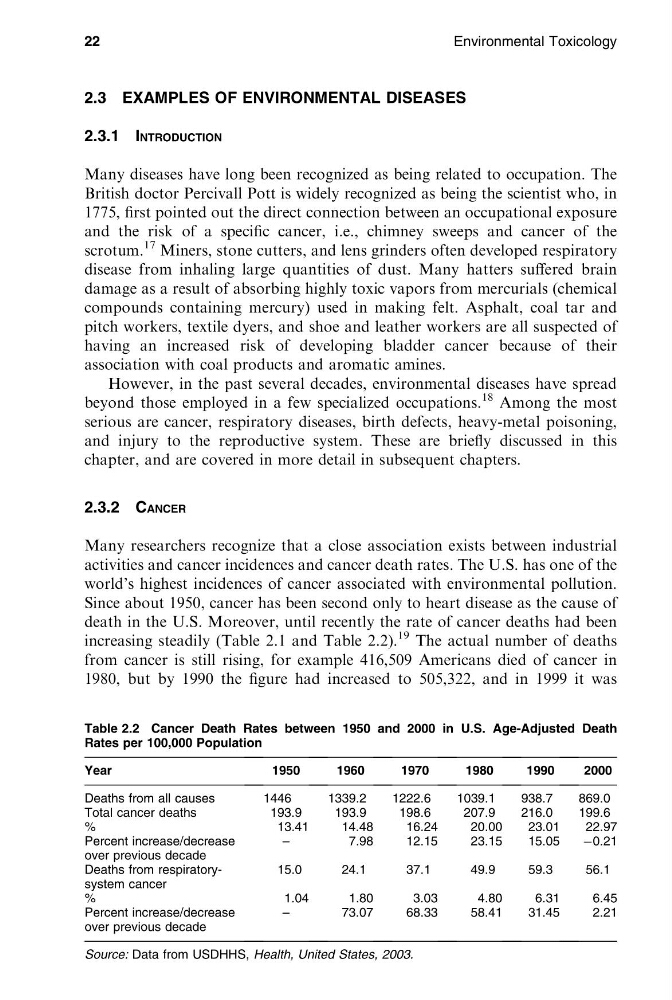
increasing steadily (Table 2.1 and Table 2.2).
19 The actual number of deaths
from cancer is still rising, for example 416,509 Americans died of cancer in
1980, but by 1990 the figure had increased to 505,322, and in 1999 it was
22
Environmental Toxicology
[16:55 26/8/04 P:/CRC PRESS/4365 MING-HO.751 (1670)/4365-002.3d]
Ref: 4365 MING-HO YU Chap-002 Page: 22 13-30
Table 2.2 Cancer Death Rates between 1950 and 2000 in U.S. Age-Adjusted Death
Rates per 100,000 Population
Year
1950
1960
1970
1980
1990
2000
Deaths from all causes
1446
1339.2
1222.6
1039.1
938.7
869.0
Total cancer deaths
193.9
193.9
198.6
207.9
216.0
199.6
%
13.41
14.48
16.24
20.00
23.01
22.97
Percent increase/decrease
over previous decade
–
7.98
12.15
23.15
15.05
À0.21
Deaths from respiratorysystem cancer
15.0
24.1
37.1
49.9
59.3
56.1
%
1.04
1.80
3.03
4.80
6.31
6.45
Percent increase/decrease
over previous decade
–
73.07
68.33
58.41
31.45
2.21
Source: Data from USDHHS, Health, United States, 2003.
2.3.1 INTRODUCTION
Many diseases have long been recognized as being related to occupation. The
British doctor Percivall Pott is widely recognized as being the scientist who, in
1775, first pointed out the direct connection between an occupational exposure
and the risk of a specific cancer, i.e., chimney sweeps and cancer of the
scrotum.
17 Miners, stone cutters, and lens grinders often developed respiratory
disease from inhaling large quantities of dust. Many hatters suffered brain
damage as a result of absorbing highly toxic vapors from mercurials (chemical
compounds containing mercury) used in making felt. Asphalt, coal tar and
pitch workers, textile dyers, and shoe and leather workers are all suspected of
having an increased risk of developing bladder cancer because of their
association with coal products and aromatic amines.
However, in the past several decades, environmental diseases have spread
beyond those employed in a few specialized occupations.
18 Among the most
serious are cancer, respiratory diseases, birth defects, heavy-metal poisoning,
and injury to the reproductive system. These are briefly discussed in this
chapter, and are covered in more detail in subsequent chapters.
2.3.2 CANCER
Many researchers recognize that a close association exists between industrial
activities and cancer incidences and cancer death rates. The U.S. has one of the
world’s highest incidences of cancer associated with environmental pollution.
Since about 1950, cancer has been second only to heart disease as the cause of
death in the U.S. Moreover, until recently the rate of cancer deaths had been
increasing steadily (Table 2.1 and Table 2.2).
19 The actual number of deaths
from cancer is still rising, for example 416,509 Americans died of cancer in
1980, but by 1990 the figure had increased to 505,322, and in 1999 it was
22
Environmental Toxicology
[16:55 26/8/04 P:/CRC PRESS/4365 MING-HO.751 (1670)/4365-002.3d]
Ref: 4365 MING-HO YU Chap-002 Page: 22 13-30
Table 2.2 Cancer Death Rates between 1950 and 2000 in U.S. Age-Adjusted Death
Rates per 100,000 Population
Year
1950
1960
1970
1980
1990
2000
Deaths from all causes
1446
1339.2
1222.6
1039.1
938.7
869.0
Total cancer deaths
193.9
193.9
198.6
207.9
216.0
199.6
%
13.41
14.48
16.24
20.00
23.01
22.97
Percent increase/decrease
over previous decade
–
7.98
12.15
23.15
15.05
À0.21
Deaths from respiratorysystem cancer
15.0
24.1
37.1
49.9
59.3
56.1
%
1.04
1.80
3.03
4.80
6.31
6.45
Percent increase/decrease
over previous decade
–
73.07
68.33
58.41
31.45
2.21
Source: Data from USDHHS, Health, United States, 2003.