

environmental concentration or the amount of the chemical administered is
used as the dose. The reaction to the dose, or the response that is elicited, can
be quantitatively determined, either by the magnitude of the response or by the
time taken for a specific response to be observed.
A graph that depicts the response of an organism, population, or biological
community to a range of concentrations of a xenobiotic is the dose–response
curve. Criteria such as the extent of DNA damage, behavioral changes, fatality,
enzyme inhibition, and other responses can be described using this relationship.
In a study to find out the response, manifested by mortality, of an organism
to an administered chemical, the distribution of mortality vs. dose (or
concentration) of the chemical is drawn so that the cumulative mortality is
plotted against each of the concentrations used. At each dose, the total number
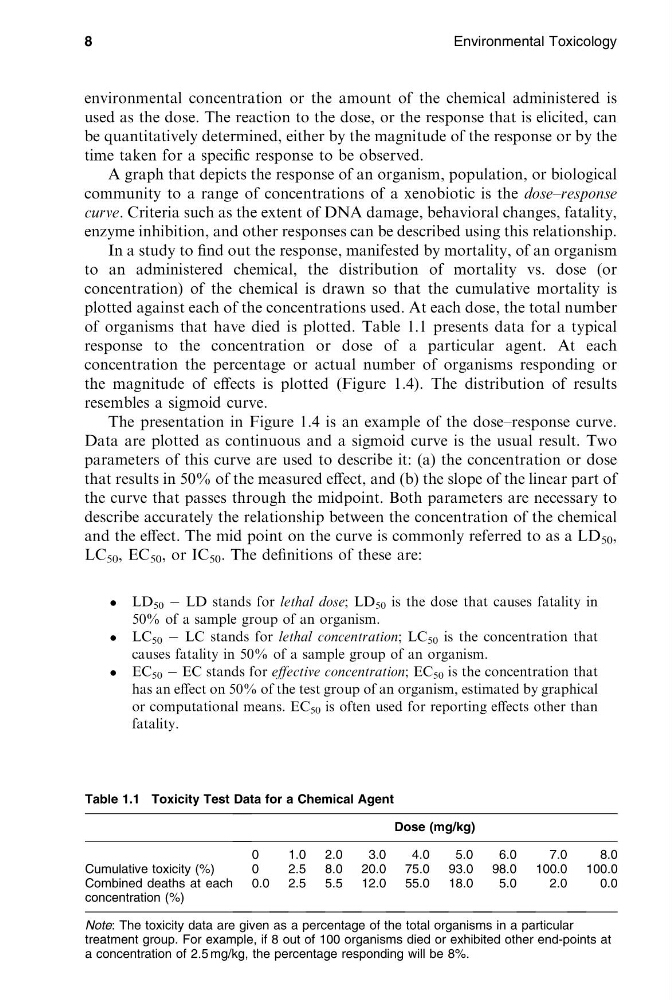
of organisms that have died is plotted. Table 1.1 presents data for a typical
response to the concentration or dose of a particular agent. At each
concentration the percentage or actual number of organisms responding or
the magnitude of effects is plotted (Figure 1.4). The distribution of results
resembles a sigmoid curve.
The presentation in Figure 1.4 is an example of the dose–response curve.
Data are plotted as continuous and a sigmoid curve is the usual result. Two
parameters of this curve are used to describe it: (a) the concentration or dose
that results in 50% of the measured effect, and (b) the slope of the linear part of
the curve that passes through the midpoint. Both parameters are necessary to
describe accurately the relationship between the concentration of the chemical
and the effect. The mid point on the curve is commonly referred to as a LD 50 ,
LC 50 , EC 50 , or IC 50 . The definitions of these are:
LD 50 À LD stands for lethal dose; LD 50 is the dose that causes fatality in
50% of a sample group of an organism.
LC 50 À LC stands for lethal concentration; LC 50 is the concentration that
causes fatality in 50% of a sample group of an organism.
EC 50 À EC stands for effective concentration; EC 50 is the concentration that
has an effect on 50% of the test group of an organism, estimated by graphical
or computational means. EC 50 is often used for reporting effects other than
fatality.
8
Environmental Toxicology
[16:55 26/8/04 P:/CRC PRESS/4365 MING-HO.751 (1670)/4365-001.3d]
Ref: 4365 MING-HO YU Chap-001 Page: 8 1-12
Table 1.1 Toxicity Test Data for a Chemical Agent
Dose (mg/kg)
0
1.0
2.0
3.0
4.0
5.0
6.0
7.0
8.0
Cumulative toxicity (%)
0
2.5
8.0 20.0 75.0 93.0 98.0 100.0 100.0
Combined deaths at each
concentration (%)
0.0 2.5
5.5 12.0 55.0 18.0
5.0
2.0
0.0
Note: The toxicity data are given as a percentage of the total organisms in a particular
treatment group. For example, if 8 out of 100 organisms died or exhibited other end-points at
a concentration of 2.5 mg/kg, the percentage responding will be 8%.
used as the dose. The reaction to the dose, or the response that is elicited, can
be quantitatively determined, either by the magnitude of the response or by the
time taken for a specific response to be observed.
A graph that depicts the response of an organism, population, or biological
community to a range of concentrations of a xenobiotic is the dose–response
curve. Criteria such as the extent of DNA damage, behavioral changes, fatality,
enzyme inhibition, and other responses can be described using this relationship.
In a study to find out the response, manifested by mortality, of an organism
to an administered chemical, the distribution of mortality vs. dose (or
concentration) of the chemical is drawn so that the cumulative mortality is
plotted against each of the concentrations used. At each dose, the total number
of organisms that have died is plotted. Table 1.1 presents data for a typical
response to the concentration or dose of a particular agent. At each
concentration the percentage or actual number of organisms responding or
the magnitude of effects is plotted (Figure 1.4). The distribution of results
resembles a sigmoid curve.
The presentation in Figure 1.4 is an example of the dose–response curve.
Data are plotted as continuous and a sigmoid curve is the usual result. Two
parameters of this curve are used to describe it: (a) the concentration or dose
that results in 50% of the measured effect, and (b) the slope of the linear part of
the curve that passes through the midpoint. Both parameters are necessary to
describe accurately the relationship between the concentration of the chemical
and the effect. The mid point on the curve is commonly referred to as a LD 50 ,
LC 50 , EC 50 , or IC 50 . The definitions of these are:
LD 50 À LD stands for lethal dose; LD 50 is the dose that causes fatality in
50% of a sample group of an organism.
LC 50 À LC stands for lethal concentration; LC 50 is the concentration that
causes fatality in 50% of a sample group of an organism.
EC 50 À EC stands for effective concentration; EC 50 is the concentration that
has an effect on 50% of the test group of an organism, estimated by graphical
or computational means. EC 50 is often used for reporting effects other than
fatality.
8
Environmental Toxicology
[16:55 26/8/04 P:/CRC PRESS/4365 MING-HO.751 (1670)/4365-001.3d]
Ref: 4365 MING-HO YU Chap-001 Page: 8 1-12
Table 1.1 Toxicity Test Data for a Chemical Agent
Dose (mg/kg)
0
1.0
2.0
3.0
4.0
5.0
6.0
7.0
8.0
Cumulative toxicity (%)
0
2.5
8.0 20.0 75.0 93.0 98.0 100.0 100.0
Combined deaths at each
concentration (%)
0.0 2.5
5.5 12.0 55.0 18.0
5.0
2.0
0.0
Note: The toxicity data are given as a percentage of the total organisms in a particular
treatment group. For example, if 8 out of 100 organisms died or exhibited other end-points at
a concentration of 2.5 mg/kg, the percentage responding will be 8%.