

Resistance and Resistivity
If we apply the same potential difference between the ends of geometrically similar rods of copper and of glass, very different currents result. The characteristic
of the conductor that enters here is its electrical resistance. We determine the resistance between any two points of a conductor by applying a potential difference
V between those points and measuring the current i that results. The resistance R
is then
(definition of R).
(26-8)
The SI unit for resistance that follows from Eq. 26-8 is the volt per ampere.This combination occurs so often that we give it a special name, the ohm (symbol ⍀); that is,
(26-9)
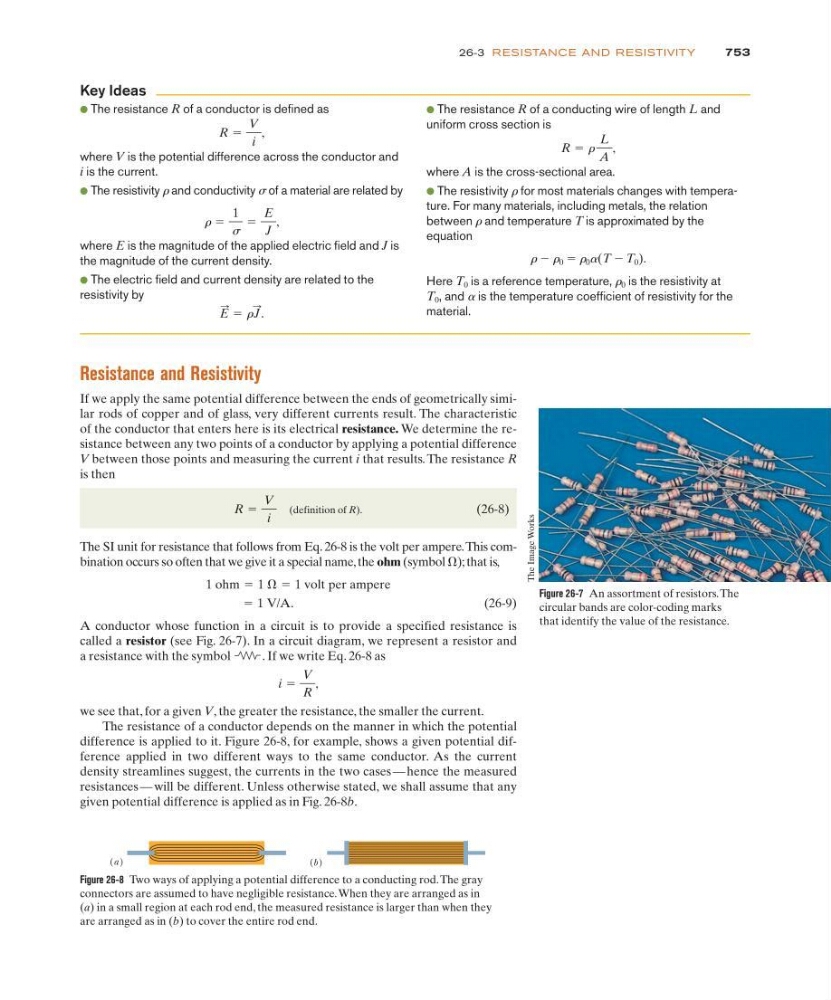
A conductor whose function in a circuit is to provide a specified resistance is
called a resistor (see Fig. 26-7). In a circuit diagram, we represent a resistor and
a resistance with the symbol
. If we write Eq. 26-8 as
we see that, for a given V, the greater the resistance, the smaller the current.
The resistance of a conductor depends on the manner in which the potential
difference is applied to it. Figure 26-8, for example, shows a given potential difference applied in two different ways to the same conductor. As the current
density streamlines suggest, the currents in the two cases — hence the measured
resistances — will be different. Unless otherwise stated, we shall assume that any
given potential difference is applied as in Fig. 26-8b.
i ϭ
V
R
,
ϭ 1 V/A.
1 ohm ϭ 1 ⍀ ϭ 1 volt per ampere
R ϭ
V
i
753
26-3 RESISTANCE AND RESISTIVITY
● The resistance R of a conductor is defined as
where V is the potential difference across the conductor and
i is the current.
● The resistivity r and conductivity s of a material are related by
where E is the magnitude of the applied electric field and J is
the magnitude of the current density.
● The electric field and current density are related to the
resistivity by
E
: ϭ r J
: .
r ϭ
1
s
ϭ
E
J
,
R ϭ
V
i
,
● The resistance R of a conducting wire of length L and
uniform cross section is
where A is the cross-sectional area.
● The resistivity r for most materials changes with temperature. For many materials, including metals, the relation
between r and temperature T is approximated by the
equation
r Ϫ r 0 ϭ r 0 a(T Ϫ T 0 ).
Here T 0 is a reference temperature, r 0 is the resistivity at
T 0 , and a is the temperature coefficient of resistivity for the
material.
R ϭ r
L
A
,
Key Ideas
Figure 26-7 An assortment of resistors. The
circular bands are color-coding marks
that identify the value of the resistance.
The Image Works
Figure 26-8 Two ways of applying a potential difference to a conducting rod. The gray
connectors are assumed to have negligible resistance. When they are arranged as in
(a) in a small region at each rod end, the measured resistance is larger than when they
are arranged as in (b) to cover the entire rod end.
(a )
(b )