

17
2-1 POSITION, DISPL ACE M E NT, AN D AVE RAG E VE LOCITY
Calculation: Here we find
(Answer)
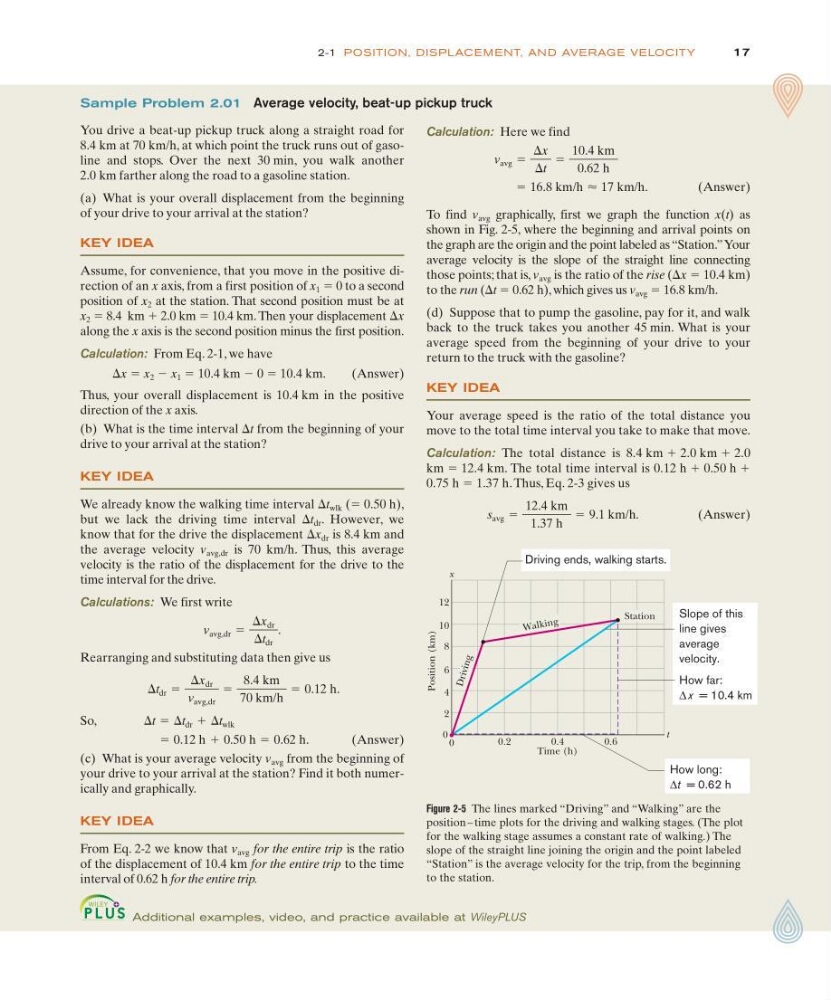
To find v avg graphically, first we graph the function x(t) as
shown in Fig. 2-5, where the beginning and arrival points on
the graph are the origin and the point labeled as “Station.”Your
average velocity is the slope of the straight line connecting
those points; that is, v avg is the ratio of the rise (⌬x ϭ 10.4 km)
to the run (⌬t ϭ 0.62 h), which gives us v avg ϭ 16.8 km/h.
(d) Suppose that to pump the gasoline, pay for it, and walk
back to the truck takes you another 45 min. What is your
average speed from the beginning of your drive to your
return to the truck with the gasoline?
KEY IDEA
Your average speed is the ratio of the total distance you
move to the total time interval you take to make that move.
Calculation: The total distance is 8.4 km ϩ 2.0 km ϩ 2.0
km ϭ 12.4 km. The total time interval is 0.12 h ϩ 0.50 h ϩ
0.75 h ϭ 1.37 h. Thus, Eq. 2-3 gives us
(Answer)
s avg ϭ
12.4 km
1.37 h
ϭ 9.1 km/h.
ϭ 16.8 km/h Ϸ 17 km/h.
v avg ϭ
⌬x
⌬t
ϭ
10.4 km
0.62 h
Sample Problem 2.01 Average velocity, beat-up pickup truck
You drive a beat-up pickup truck along a straight road for
8.4 km at 70 km/h, at which point the truck runs out of gasoline and stops. Over the next 30 min, you walk another
2.0 km farther along the road to a gasoline station.
(a) What is your overall displacement from the beginning
of your drive to your arrival at the station?
KEY IDEA
Assume, for convenience, that you move in the positive direction of an x axis, from a first position of x 1 ϭ 0 to a second
position of x 2 at the station. That second position must be at
x 2 ϭ 8.4 km ϩ 2.0 km ϭ 10.4 km. Then your displacement ⌬x
along the x axis is the second position minus the first position.
Calculation: From Eq. 2-1, we have
⌬x ϭ x 2 Ϫ x 1 ϭ 10.4 km Ϫ 0 ϭ 10.4 km.
(Answer)
Thus, your overall displacement is 10.4 km in the positive
direction of the x axis.
(b) What is the time interval ⌬t from the beginning of your
drive to your arrival at the station?
KEY IDEA
We already know the walking time interval ⌬t wlk (ϭ 0.50 h),
but we lack the driving time interval ⌬t dr . However, we
know that for the drive the displacement ⌬x dr is 8.4 km and
the average velocity v avg,dr is 70 km/h. Thus, this average
velocity is the ratio of the displacement for the drive to the
time interval for the drive.
Calculations: We first write
Rearranging and substituting data then give us
So,
(Answer)
(c) What is your average velocity v avg from the beginning of
your drive to your arrival at the station? Find it both numerically and graphically.
KEY IDEA
From Eq. 2-2 we know that v avg for the entire trip is the ratio
of the displacement of 10.4 km for the entire trip to the time
interval of 0.62 h for the entire trip.
ϭ 0.12 h ϩ 0.50 h ϭ 0.62 h.
⌬t ϭ ⌬t dr ϩ ⌬t wlk
⌬t dr ϭ
⌬x dr
v avg,dr
ϭ
8.4 km
70 km/h
ϭ 0.12 h.
v avg,dr ϭ
⌬x dr
⌬t dr
.
Additional examples, video, and practice available at WileyPLUS
Figure 2-5 The lines marked “Driving” and “Walking” are the
position – time plots for the driving and walking stages. (The plot
for the walking stage assumes a constant rate of walking.) The
slope of the straight line joining the origin and the point labeled
“Station” is the average velocity for the trip, from the beginning
to the station.
Position (km)
Time (h)
0 0
0.2
0.4
0.6
2
4
6
8
10
12
x
t
W al ki ng
D ri vi n g
How far:
∆ x = 10.4 km
Station
Driving ends, walking starts.
Slope of this
line gives
average
velocity.
How long:
∆t = 0.62 h
2-1 POSITION, DISPL ACE M E NT, AN D AVE RAG E VE LOCITY
Calculation: Here we find
(Answer)
To find v avg graphically, first we graph the function x(t) as
shown in Fig. 2-5, where the beginning and arrival points on
the graph are the origin and the point labeled as “Station.”Your
average velocity is the slope of the straight line connecting
those points; that is, v avg is the ratio of the rise (⌬x ϭ 10.4 km)
to the run (⌬t ϭ 0.62 h), which gives us v avg ϭ 16.8 km/h.
(d) Suppose that to pump the gasoline, pay for it, and walk
back to the truck takes you another 45 min. What is your
average speed from the beginning of your drive to your
return to the truck with the gasoline?
KEY IDEA
Your average speed is the ratio of the total distance you
move to the total time interval you take to make that move.
Calculation: The total distance is 8.4 km ϩ 2.0 km ϩ 2.0
km ϭ 12.4 km. The total time interval is 0.12 h ϩ 0.50 h ϩ
0.75 h ϭ 1.37 h. Thus, Eq. 2-3 gives us
(Answer)
s avg ϭ
12.4 km
1.37 h
ϭ 9.1 km/h.
ϭ 16.8 km/h Ϸ 17 km/h.
v avg ϭ
⌬x
⌬t
ϭ
10.4 km
0.62 h
Sample Problem 2.01 Average velocity, beat-up pickup truck
You drive a beat-up pickup truck along a straight road for
8.4 km at 70 km/h, at which point the truck runs out of gasoline and stops. Over the next 30 min, you walk another
2.0 km farther along the road to a gasoline station.
(a) What is your overall displacement from the beginning
of your drive to your arrival at the station?
KEY IDEA
Assume, for convenience, that you move in the positive direction of an x axis, from a first position of x 1 ϭ 0 to a second
position of x 2 at the station. That second position must be at
x 2 ϭ 8.4 km ϩ 2.0 km ϭ 10.4 km. Then your displacement ⌬x
along the x axis is the second position minus the first position.
Calculation: From Eq. 2-1, we have
⌬x ϭ x 2 Ϫ x 1 ϭ 10.4 km Ϫ 0 ϭ 10.4 km.
(Answer)
Thus, your overall displacement is 10.4 km in the positive
direction of the x axis.
(b) What is the time interval ⌬t from the beginning of your
drive to your arrival at the station?
KEY IDEA
We already know the walking time interval ⌬t wlk (ϭ 0.50 h),
but we lack the driving time interval ⌬t dr . However, we
know that for the drive the displacement ⌬x dr is 8.4 km and
the average velocity v avg,dr is 70 km/h. Thus, this average
velocity is the ratio of the displacement for the drive to the
time interval for the drive.
Calculations: We first write
Rearranging and substituting data then give us
So,
(Answer)
(c) What is your average velocity v avg from the beginning of
your drive to your arrival at the station? Find it both numerically and graphically.
KEY IDEA
From Eq. 2-2 we know that v avg for the entire trip is the ratio
of the displacement of 10.4 km for the entire trip to the time
interval of 0.62 h for the entire trip.
ϭ 0.12 h ϩ 0.50 h ϭ 0.62 h.
⌬t ϭ ⌬t dr ϩ ⌬t wlk
⌬t dr ϭ
⌬x dr
v avg,dr
ϭ
8.4 km
70 km/h
ϭ 0.12 h.
v avg,dr ϭ
⌬x dr
⌬t dr
.
Additional examples, video, and practice available at WileyPLUS
Figure 2-5 The lines marked “Driving” and “Walking” are the
position – time plots for the driving and walking stages. (The plot
for the walking stage assumes a constant rate of walking.) The
slope of the straight line joining the origin and the point labeled
“Station” is the average velocity for the trip, from the beginning
to the station.
Position (km)
Time (h)
0 0
0.2
0.4
0.6
2
4
6
8
10
12
x
t
W al ki ng
D ri vi n g
How far:
∆ x = 10.4 km
Station
Driving ends, walking starts.
Slope of this
line gives
average
velocity.
How long:
∆t = 0.62 h