

Copyright © National Academy of Sciences. All rights reserved.
Solar and Space Physics: A Science for a Technological Society
APPENDIX D
363
0
10
20
30
40
50
60
70
2001
2002
2003
2004
2005
2006
2007
2008
2009
2010
Postdocs US
Postdocs Outside US
Number of Postdoc Positions
Year
Figure D-7
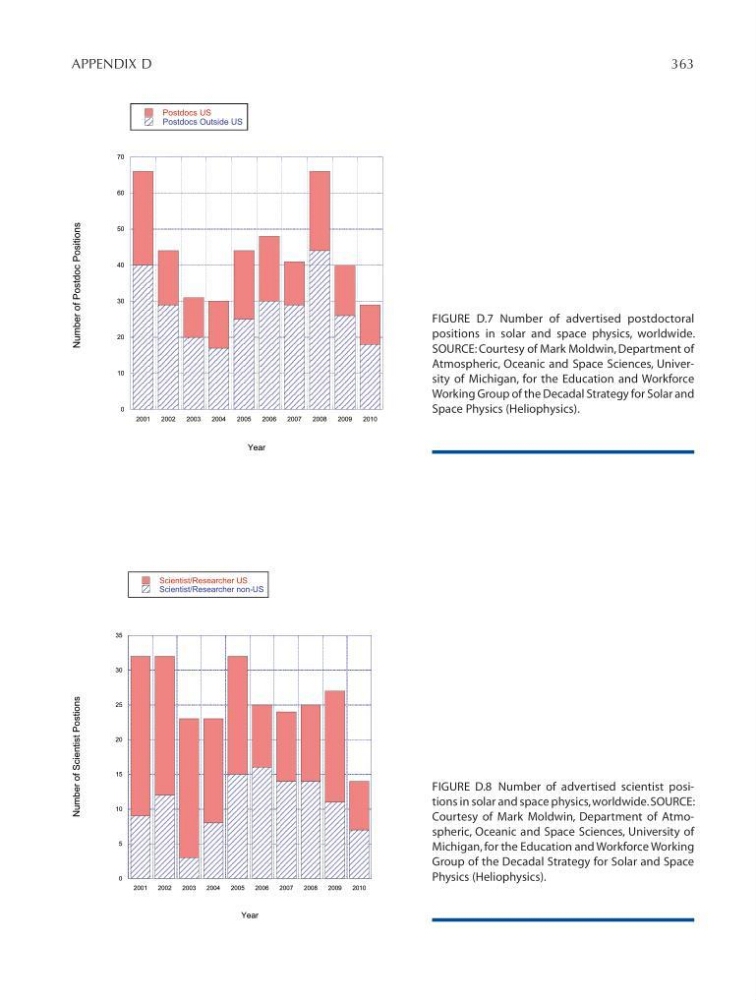
FIGURE D.7 Number of advertised postdoctoral
positions in solar and space physics, worldwide.
SOURCE: Courtesy of Mark Moldwin, Department of
Atmospheric, Oceanic and Space Sciences, University of Michigan, for the Education and Workforce
Working Group of the Decadal Strategy for Solar and
Space Physics (Heliophysics).
FIGURE D.8 Number of advertised scientist positions in solar and space physics, worldwide. SOURCE:
Courtesy of Mark Moldwin, Department of Atmospheric, Oceanic and Space Sciences, University of
Michigan, for the Education and Workforce Working
Group of the Decadal Strategy for Solar and Space
Physics (Heliophysics).
0
5
10
15
20
25
30
35
2001
2002
2003
2004
2005
2006
2007
2008
2009
2010
Number of Unique Scientist Positions (SPD + SPA)
Scientist/Researcher US
Scientist/Researcher non-US
Number of Scientist Postions
Year
Figure D-8
Solar and Space Physics: A Science for a Technological Society
APPENDIX D
363
0
10
20
30
40
50
60
70
2001
2002
2003
2004
2005
2006
2007
2008
2009
2010
Postdocs US
Postdocs Outside US
Number of Postdoc Positions
Year
Figure D-7
FIGURE D.7 Number of advertised postdoctoral
positions in solar and space physics, worldwide.
SOURCE: Courtesy of Mark Moldwin, Department of
Atmospheric, Oceanic and Space Sciences, University of Michigan, for the Education and Workforce
Working Group of the Decadal Strategy for Solar and
Space Physics (Heliophysics).
FIGURE D.8 Number of advertised scientist positions in solar and space physics, worldwide. SOURCE:
Courtesy of Mark Moldwin, Department of Atmospheric, Oceanic and Space Sciences, University of
Michigan, for the Education and Workforce Working
Group of the Decadal Strategy for Solar and Space
Physics (Heliophysics).
0
5
10
15
20
25
30
35
2001
2002
2003
2004
2005
2006
2007
2008
2009
2010
Number of Unique Scientist Positions (SPD + SPA)
Scientist/Researcher US
Scientist/Researcher non-US
Number of Scientist Postions
Year
Figure D-8