

Copyright © National Academy of Sciences. All rights reserved.
Solar and Space Physics: A Science for a Technological Society
APPENDIX D
359
EMPLOYMENT OPPORTUNITIES STUDY
To assess the state of health of the field of solar and space physics, an analysis of the number of job
postings produced each year was done for the decade 2001-2010. A compilation of the job advertisements
listed in the AAS’s SPD and the AGU’s SPA electronic newsletters was done for the period 2001 to 2010.
The positions were sorted into four types (faculty, postdoctoral researcher, scientist, and staff), institution
type (academic, government laboratory, or industry), and whether the position was located inside or outside
the United States. The scientist position includes any non-faculty or postdoctoral position that required
a Ph.D. and included civil service and soft-money research positions. Support staff positions, such as an
observatory telescope operator or computer programmer, often did not require a Ph.D. One finding from
the job advertisement survey was that there was very little (about 20 percent) overlap in the job postings
(i.e., jobs advertised in the SPD newsletter were generally not advertised in the SPA newsletter, and vice
versa), indicating that the communities are distinct. However, this was not true for faculty advertisements.
Most faculty positions were advertised in both the SPD and SPA newsletters. Worldwide, 949 solar and
space physics positions were advertised over the decade, with 52 percent of the jobs located outside the
United States.
Figure D.3 shows unique positions advertised for the United States (SPD + SPA) over the decade by
job type (faculty, scientist, and postdoctoral researcher). Jobs advertised in both SPA and SPD were not
double counted. A disconcerting trend is a decline in job advertisements in 2010 for all types of positions.
The total number advertised for each type in 2010 was the lowest number in the decade. For both com-5
0
5
10
15
20
25
30
2001
2003
2005
2007
2009
PhD by Sub-Field
Helio
Magnetosphere
ITM
Solar
Space Plasma
Number of PhDs
Year
Figure D-2
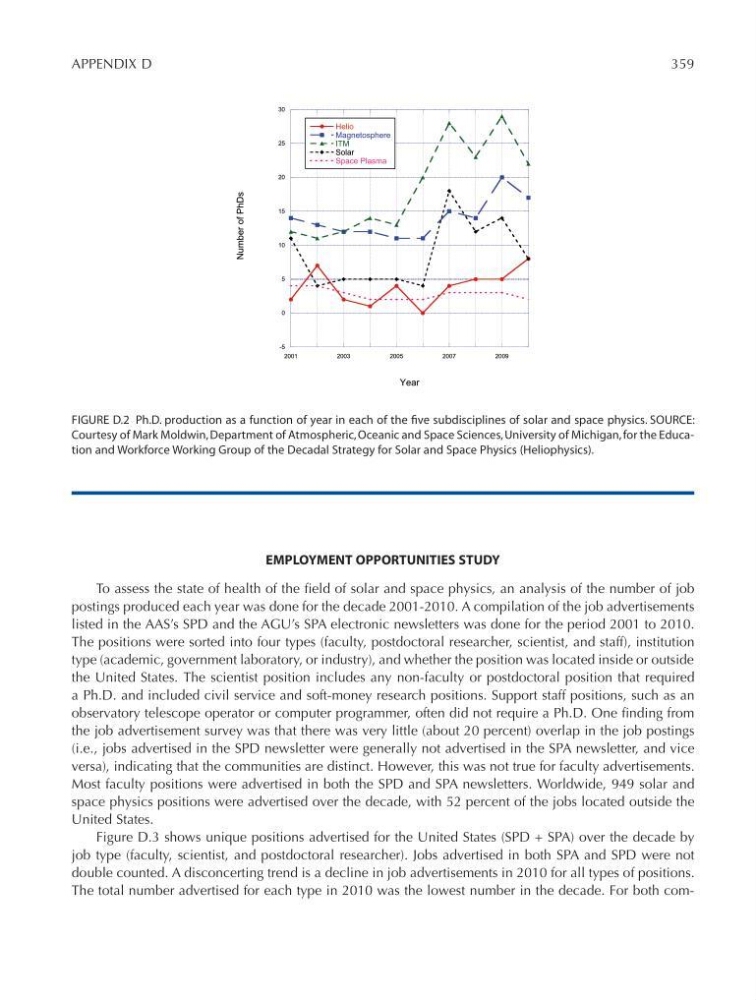
FIGURE D.2 Ph.D. production as a function of year in each of the five subdisciplines of solar and space physics. SOURCE:
Courtesy of Mark Moldwin, Department of Atmospheric, Oceanic and Space Sciences, University of Michigan, for the Education and Workforce Working Group of the Decadal Strategy for Solar and Space Physics (Heliophysics).
Solar and Space Physics: A Science for a Technological Society
APPENDIX D
359
EMPLOYMENT OPPORTUNITIES STUDY
To assess the state of health of the field of solar and space physics, an analysis of the number of job
postings produced each year was done for the decade 2001-2010. A compilation of the job advertisements
listed in the AAS’s SPD and the AGU’s SPA electronic newsletters was done for the period 2001 to 2010.
The positions were sorted into four types (faculty, postdoctoral researcher, scientist, and staff), institution
type (academic, government laboratory, or industry), and whether the position was located inside or outside
the United States. The scientist position includes any non-faculty or postdoctoral position that required
a Ph.D. and included civil service and soft-money research positions. Support staff positions, such as an
observatory telescope operator or computer programmer, often did not require a Ph.D. One finding from
the job advertisement survey was that there was very little (about 20 percent) overlap in the job postings
(i.e., jobs advertised in the SPD newsletter were generally not advertised in the SPA newsletter, and vice
versa), indicating that the communities are distinct. However, this was not true for faculty advertisements.
Most faculty positions were advertised in both the SPD and SPA newsletters. Worldwide, 949 solar and
space physics positions were advertised over the decade, with 52 percent of the jobs located outside the
United States.
Figure D.3 shows unique positions advertised for the United States (SPD + SPA) over the decade by
job type (faculty, scientist, and postdoctoral researcher). Jobs advertised in both SPA and SPD were not
double counted. A disconcerting trend is a decline in job advertisements in 2010 for all types of positions.
The total number advertised for each type in 2010 was the lowest number in the decade. For both com-5
0
5
10
15
20
25
30
2001
2003
2005
2007
2009
PhD by Sub-Field
Helio
Magnetosphere
ITM
Solar
Space Plasma
Number of PhDs
Year
Figure D-2
FIGURE D.2 Ph.D. production as a function of year in each of the five subdisciplines of solar and space physics. SOURCE:
Courtesy of Mark Moldwin, Department of Atmospheric, Oceanic and Space Sciences, University of Michigan, for the Education and Workforce Working Group of the Decadal Strategy for Solar and Space Physics (Heliophysics).