

ML Based Rank Attack Detection for Smart Hospital Infrastructure
35
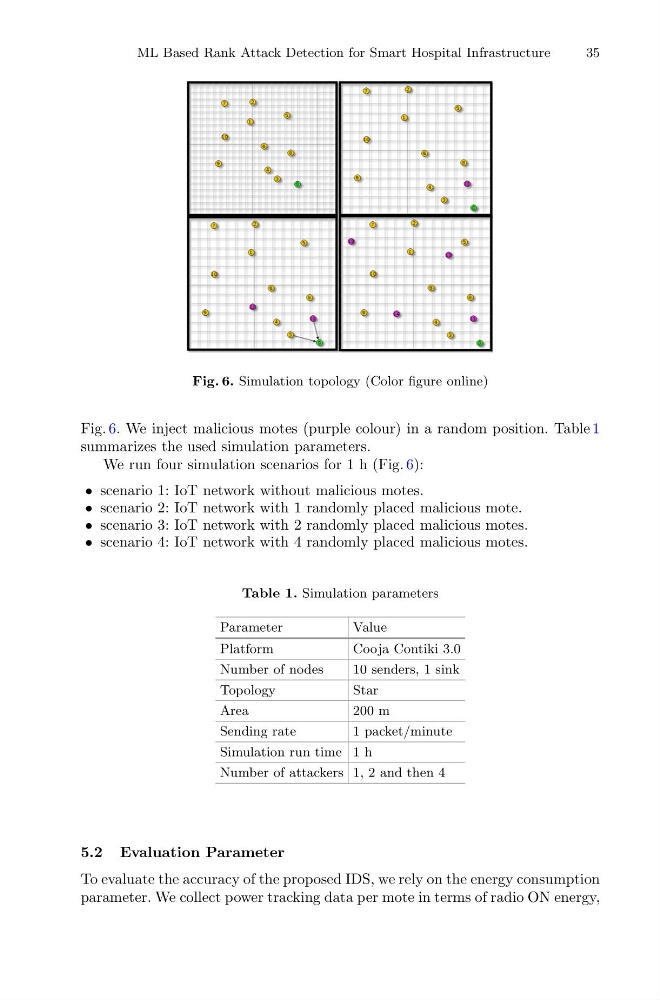
Fig. 6. Simulation topology (Color figure online)
Fig. 6. We inject malicious motes (purple colour) in a random position. Table 1
summarizes the used simulation parameters.
We run four simulation scenarios for 1 h (Fig. 6):
• scenario 1: IoT network without malicious motes.
• scenario 2: IoT network with 1 randomly placed malicious mote.
• scenario 3: IoT network with 2 randomly placed malicious motes.
• scenario 4: IoT network with 4 randomly placed malicious motes.
Table 1. Simulation parameters
Parameter
Value
Platform
Cooja Contiki 3.0
Number of nodes
10 senders, 1 sink
Topology
Star
Area
200 m
Sending rate
1 packet/minute
Simulation run time 1 h
Number of attackers 1, 2 and then 4
5.2 Evaluation Parameter
To evaluate the accuracy of the proposed IDS, we rely on the energy consumption
parameter. We collect power tracking data per mote in terms of radio ON energy,
35
Fig. 6. Simulation topology (Color figure online)
Fig. 6. We inject malicious motes (purple colour) in a random position. Table 1
summarizes the used simulation parameters.
We run four simulation scenarios for 1 h (Fig. 6):
• scenario 1: IoT network without malicious motes.
• scenario 2: IoT network with 1 randomly placed malicious mote.
• scenario 3: IoT network with 2 randomly placed malicious motes.
• scenario 4: IoT network with 4 randomly placed malicious motes.
Table 1. Simulation parameters
Parameter
Value
Platform
Cooja Contiki 3.0
Number of nodes
10 senders, 1 sink
Topology
Star
Area
200 m
Sending rate
1 packet/minute
Simulation run time 1 h
Number of attackers 1, 2 and then 4
5.2 Evaluation Parameter
To evaluate the accuracy of the proposed IDS, we rely on the energy consumption
parameter. We collect power tracking data per mote in terms of radio ON energy,