

many types of data used in public health in a visual and concise manner [13, 14]. For
example, it permits the study of general geographical patterns in health data and
identifying specific high-risk locations. An example of these maps in PULSE are the
personal exposure maps. Personal exposure is a concept from the epidemiological
science to quantify the amount of pollution that each individual is exposed to, as a
consequence of the living environment, habits etc.
Personal exposure has been obtained matching the data from the dense network of
low-cost sensors and the informations on habits coming from the PulsAIR app. Following the sampling rate of the sensors the data has been calculated.
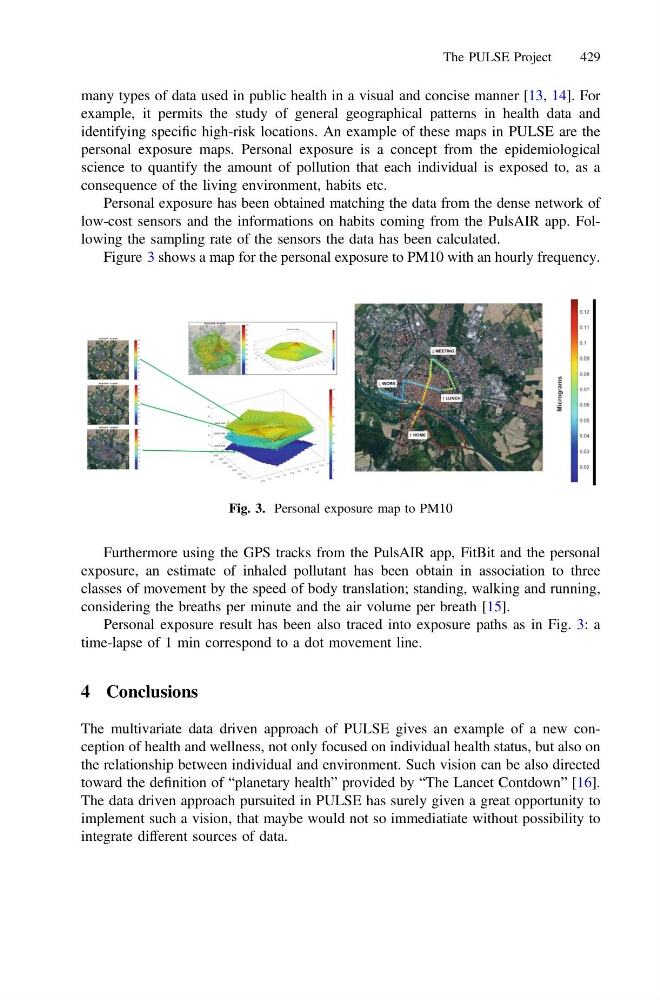
Figure 3 shows a map for the personal exposure to PM10 with an hourly frequency.
Furthermore using the GPS tracks from the PulsAIR app, FitBit and the personal
exposure, an estimate of inhaled pollutant has been obtain in association to three
classes of movement by the speed of body translation; standing, walking and running,
considering the breaths per minute and the air volume per breath [15].
Personal exposure result has been also traced into exposure paths as in Fig. 3: a
time-lapse of 1 min correspond to a dot movement line.
4 Conclusions
The multivariate data driven approach of PULSE gives an example of a new conception of health and wellness, not only focused on individual health status, but also on
the relationship between individual and environment. Such vision can be also directed
toward the definition of “planetary health” provided by “The Lancet Contdown” [16].
The data driven approach pursuited in PULSE has surely given a great opportunity to
implement such a vision, that maybe would not so immediatiate without possibility to
integrate different sources of data.
Fig. 3. Personal exposure map to PM10
The PULSE Project
429
example, it permits the study of general geographical patterns in health data and
identifying specific high-risk locations. An example of these maps in PULSE are the
personal exposure maps. Personal exposure is a concept from the epidemiological
science to quantify the amount of pollution that each individual is exposed to, as a
consequence of the living environment, habits etc.
Personal exposure has been obtained matching the data from the dense network of
low-cost sensors and the informations on habits coming from the PulsAIR app. Following the sampling rate of the sensors the data has been calculated.
Figure 3 shows a map for the personal exposure to PM10 with an hourly frequency.
Furthermore using the GPS tracks from the PulsAIR app, FitBit and the personal
exposure, an estimate of inhaled pollutant has been obtain in association to three
classes of movement by the speed of body translation; standing, walking and running,
considering the breaths per minute and the air volume per breath [15].
Personal exposure result has been also traced into exposure paths as in Fig. 3: a
time-lapse of 1 min correspond to a dot movement line.
4 Conclusions
The multivariate data driven approach of PULSE gives an example of a new conception of health and wellness, not only focused on individual health status, but also on
the relationship between individual and environment. Such vision can be also directed
toward the definition of “planetary health” provided by “The Lancet Contdown” [16].
The data driven approach pursuited in PULSE has surely given a great opportunity to
implement such a vision, that maybe would not so immediatiate without possibility to
integrate different sources of data.
Fig. 3. Personal exposure map to PM10
The PULSE Project
429