

134
D. Zekri et al.
The duration score is calculated by the formula (2). It is a percentage of the
duration of an activity in an observed day compared to the duration of the same
activity in the normal behavior pattern.
Duration score =
D ad ∗ 100
D an
(2)
The duration score for one day is the average of duration scores for all activities occurring on this day. The duration score can exceed 100% if the duration
of an activity at the observed day is greater than the expected duration in
the normal behavior pattern. This simply means that the elderly takes longer
to achieve the activity which may be caused by a loss of autonomy if this is
observed regularly.
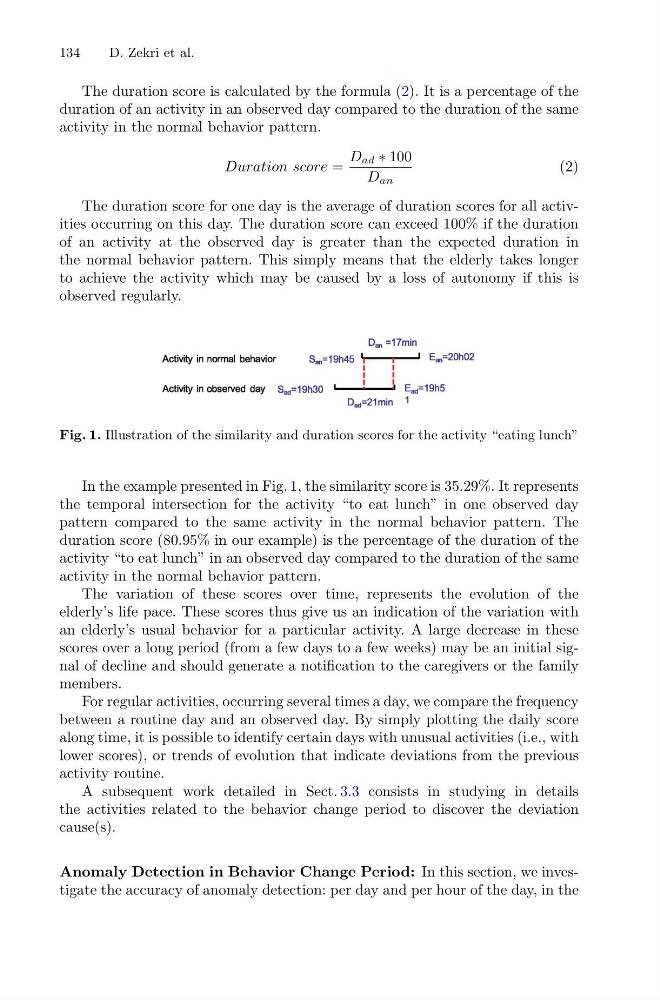
Fig. 1. Illustration of the similarity and duration scores for the activity “eating lunch”
In the example presented in Fig. 1, the similarity score is 35.29%. It represents
the temporal intersection for the activity “to eat lunch” in one observed day
pattern compared to the same activity in the normal behavior pattern. The
duration score (80.95% in our example) is the percentage of the duration of the
activity “to eat lunch” in an observed day compared to the duration of the same
activity in the normal behavior pattern.
The variation of these scores over time, represents the evolution of the
elderly’s life pace. These scores thus give us an indication of the variation with
an elderly’s usual behavior for a particular activity. A large decrease in these
scores over a long period (from a few days to a few weeks) may be an initial signal of decline and should generate a notification to the caregivers or the family
members.
For regular activities, occurring several times a day, we compare the frequency
between a routine day and an observed day. By simply plotting the daily score
along time, it is possible to identify certain days with unusual activities (i.e., with
lower scores), or trends of evolution that indicate deviations from the previous
activity routine.
A subsequent work detailed in Sect. 3.3 consists in studying in details
the activities related to the behavior change period to discover the deviation
cause(s).
Anomaly Detection in Behavior Change Period: In this section, we investigate the accuracy of anomaly detection: per day and per hour of the day, in the
D. Zekri et al.
The duration score is calculated by the formula (2). It is a percentage of the
duration of an activity in an observed day compared to the duration of the same
activity in the normal behavior pattern.
Duration score =
D ad ∗ 100
D an
(2)
The duration score for one day is the average of duration scores for all activities occurring on this day. The duration score can exceed 100% if the duration
of an activity at the observed day is greater than the expected duration in
the normal behavior pattern. This simply means that the elderly takes longer
to achieve the activity which may be caused by a loss of autonomy if this is
observed regularly.
Fig. 1. Illustration of the similarity and duration scores for the activity “eating lunch”
In the example presented in Fig. 1, the similarity score is 35.29%. It represents
the temporal intersection for the activity “to eat lunch” in one observed day
pattern compared to the same activity in the normal behavior pattern. The
duration score (80.95% in our example) is the percentage of the duration of the
activity “to eat lunch” in an observed day compared to the duration of the same
activity in the normal behavior pattern.
The variation of these scores over time, represents the evolution of the
elderly’s life pace. These scores thus give us an indication of the variation with
an elderly’s usual behavior for a particular activity. A large decrease in these
scores over a long period (from a few days to a few weeks) may be an initial signal of decline and should generate a notification to the caregivers or the family
members.
For regular activities, occurring several times a day, we compare the frequency
between a routine day and an observed day. By simply plotting the daily score
along time, it is possible to identify certain days with unusual activities (i.e., with
lower scores), or trends of evolution that indicate deviations from the previous
activity routine.
A subsequent work detailed in Sect. 3.3 consists in studying in details
the activities related to the behavior change period to discover the deviation
cause(s).
Anomaly Detection in Behavior Change Period: In this section, we investigate the accuracy of anomaly detection: per day and per hour of the day, in the