

1.6 Plotting, Printing and Input Data
31
dt = 0.55
t = t0 + 0*dt; g = t*sin(t)
print(’{:6.2f} {:8.3f}’.format(t, g))
t = t0 + 1*dt; g = t*sin(t)
print(’{:6.2f} {:8.3f}’.format(t, g))
t = t0 + 2*dt; g = t*sin(t)
print(’{:6.2f} {:8.3f}’.format(t, g))
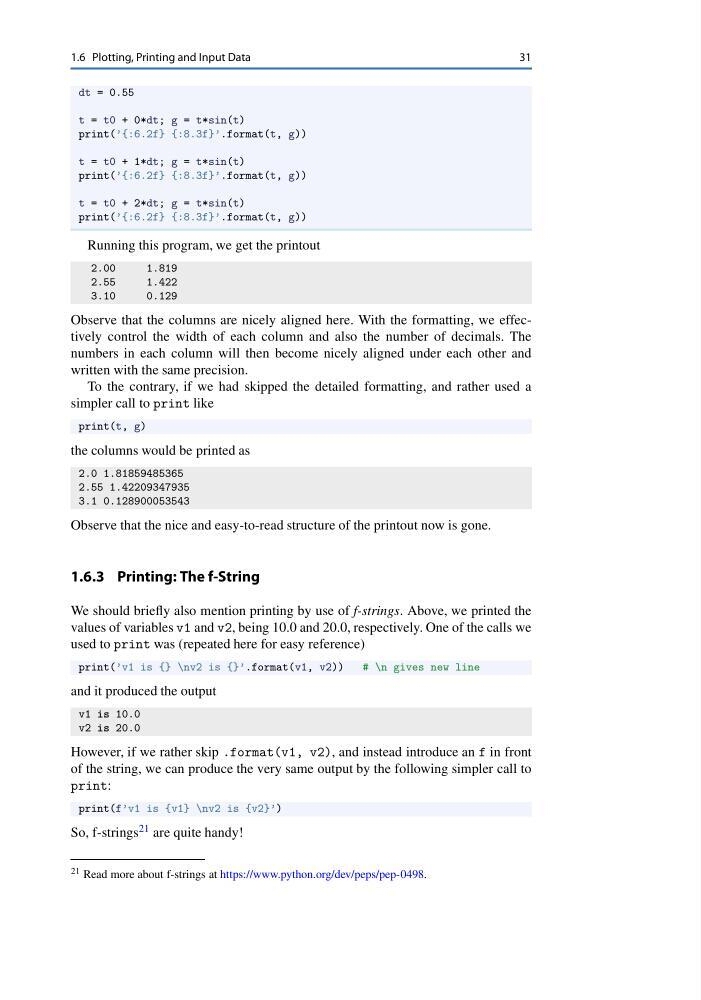
Running this program, we get the printout
2.00
1.819
2.55
1.422
3.10
0.129
Observe that the columns are nicely aligned here. With the formatting, we effectively control the width of each column and also the number of decimals. The
numbers in each column will then become nicely aligned under each other and
written with the same precision.
To the contrary, if we had skipped the detailed formatting, and rather used a
simpler call to print like
print(t, g)
the columns would be printed as
2.0 1.81859485365
2.55 1.42209347935
3.1 0.128900053543
Observe that the nice and easy-to-read structure of the printout now is gone.
1.6.3 Printing: The f-String
We should briefly also mention printing by use of f-strings. Above, we printed the
values of variables v1 and v2, being 10.0 and 20.0, respectively. One of the calls we
used to print was (repeated here for easy reference)
print(’v1 is {} \nv2 is {}’.format(v1, v2))
# \n gives new line
and it produced the output
v1 is 10.0
v2 is 20.0
However, if we rather skip .format(v1, v2), and instead introduce an f in front
of the string, we can produce the very same output by the following simpler call to
print:
print(f’v1 is {v1} \nv2 is {v2}’)
So, f-strings 21 are quite handy!
21 Read more about f-strings at https://www.python.org/dev/peps/pep-0498.
31
dt = 0.55
t = t0 + 0*dt; g = t*sin(t)
print(’{:6.2f} {:8.3f}’.format(t, g))
t = t0 + 1*dt; g = t*sin(t)
print(’{:6.2f} {:8.3f}’.format(t, g))
t = t0 + 2*dt; g = t*sin(t)
print(’{:6.2f} {:8.3f}’.format(t, g))
Running this program, we get the printout
2.00
1.819
2.55
1.422
3.10
0.129
Observe that the columns are nicely aligned here. With the formatting, we effectively control the width of each column and also the number of decimals. The
numbers in each column will then become nicely aligned under each other and
written with the same precision.
To the contrary, if we had skipped the detailed formatting, and rather used a
simpler call to print like
print(t, g)
the columns would be printed as
2.0 1.81859485365
2.55 1.42209347935
3.1 0.128900053543
Observe that the nice and easy-to-read structure of the printout now is gone.
1.6.3 Printing: The f-String
We should briefly also mention printing by use of f-strings. Above, we printed the
values of variables v1 and v2, being 10.0 and 20.0, respectively. One of the calls we
used to print was (repeated here for easy reference)
print(’v1 is {} \nv2 is {}’.format(v1, v2))
# \n gives new line
and it produced the output
v1 is 10.0
v2 is 20.0
However, if we rather skip .format(v1, v2), and instead introduce an f in front
of the string, we can produce the very same output by the following simpler call to
print:
print(f’v1 is {v1} \nv2 is {v2}’)
So, f-strings 21 are quite handy!
21 Read more about f-strings at https://www.python.org/dev/peps/pep-0498.