

300
M. Cubuktepe et al.
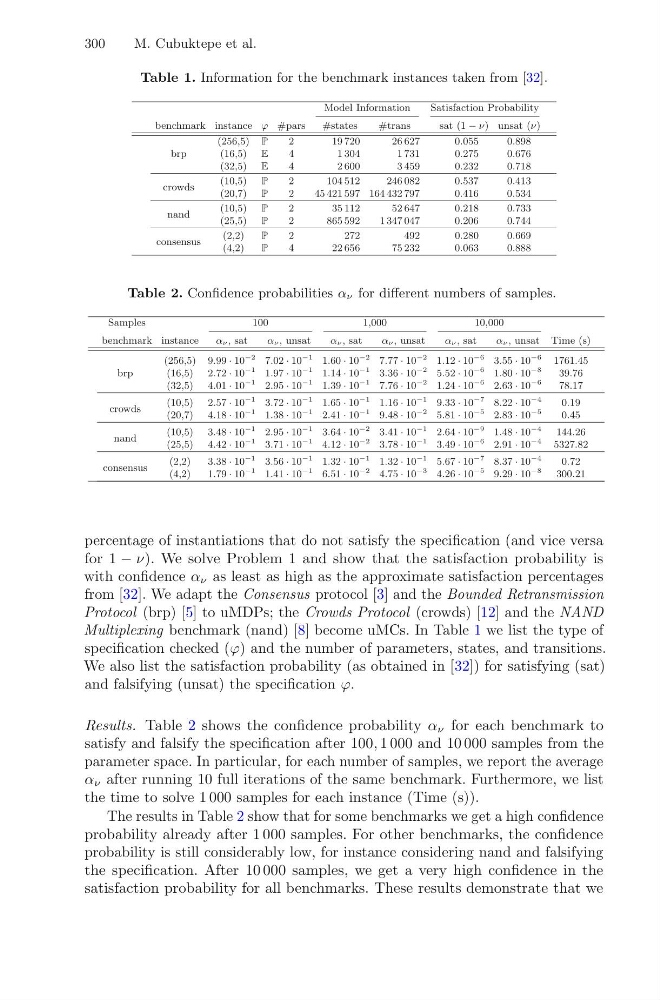
Table 1. Information for the benchmark instances taken from [32].
Model Information
Satisfaction Probability
benchmark instance ϕ #pars
#states
#trans
sat (1 − ν) unsat (ν)
brp
(256,5) P
2
19 720
26 627
0.055
0.898
(16,5) E
4
1 304
1 731
0.275
0.676
(32,5) E
4
2 600
3 459
0.232
0.718
crowds
(10,5) P
2
104 512
246 082
0.537
0.413
(20,7) P
2
45 421 597 164 432 797
0.416
0.534
nand
(10,5) P
2
35 112
52 647
0.218
0.733
(25,5) P
2
865 592
1 347 047
0.206
0.744
consensus
(2,2)
P
2
272
492
0.280
0.669
(4,2)
P
4
22 656
75 232
0.063
0.888
Table 2. Confidence probabilities αν for different numbers of samples.
Samples
100
1,000
10,000
benchmark instance
αν , sat
αν , unsat
αν , sat
αν , unsat
αν , sat
αν , unsat Time (s)
brp
(256,5) 9.99 · 10
−2 7.02 · 10
−1 1.60 · 10
−2 7.77 · 10
−2 1.12 · 10
−6 3.55 · 10
−6
1761.45
(16,5) 2.72 · 10
−1 1.97 · 10
−1 1.14 · 10
−1 3.36 · 10
−2 5.52 · 10
−6 1.80 · 10
−8
39.76
(32,5) 4.01 · 10
−1 2.95 · 10
−1 1.39 · 10
−1 7.76 · 10
−2 1.24 · 10
−6 2.63 · 10
−6
78.17
crowds
(10,5) 2.57 · 10
−1 3.72 · 10
−1 1.65 · 10
−1 1.16 · 10
−1 9.33 · 10
−7 8.22 · 10
−4
0.19
(20,7) 4.18 · 10
−1 1.38 · 10
−1 2.41 · 10
−1 9.48 · 10
−2 5.81 · 10
−5 2.83 · 10
−5
0.45
nand
(10,5) 3.48 · 10
−1 2.95 · 10
−1 3.64 · 10
−2 3.41 · 10
−1 2.64 · 10
−9 1.48 · 10
−4
144.26
(25,5) 4.42 · 10
−1 3.71 · 10
−1 4.12 · 10
−2 3.78 · 10
−1 3.49 · 10
−6 2.91 · 10
−4
5327.82
consensus
(2,2)
3.38 · 10
−1 3.56 · 10
−1 1.32 · 10
−1 1.32 · 10
−1 5.67 · 10
−7 8.37 · 10
−4
0.72
(4,2)
1.79 · 10
−1 1.41 · 10
−1 6.51 · 10
−2 4.75 · 10
−3 4.26 · 10
−5 9.29 · 10
−8
300.21
percentage of instantiations that do not satisfy the specification (and vice versa
for 1 − ν). We solve Problem 1 and show that the satisfaction probability is
with confidence α ν as least as high as the approximate satisfaction percentages
from [32]. We adapt the Consensus protocol [3] and the Bounded Retransmission
Protocol (brp) [5] to uMDPs; the Crowds Protocol (crowds) [12] and the NAND
Multiplexing benchmark (nand) [8] become uMCs. In Table 1 we list the type of
specification checked (ϕ) and the number of parameters, states, and transitions.
We also list the satisfaction probability (as obtained in [32]) for satisfying (sat)
and falsifying (unsat) the specification ϕ.
Results. Table 2 shows the confidence probability α ν for each benchmark to
satisfy and falsify the specification after 100, 1 000 and 10 000 samples from the
parameter space. In particular, for each number of samples, we report the average
α ν after running 10 full iterations of the same benchmark. Furthermore, we list
the time to solve 1 000 samples for each instance (Time (s)).
The results in Table 2 show that for some benchmarks we get a high confidence
probability already after 1 000 samples. For other benchmarks, the confidence
probability is still considerably low, for instance considering nand and falsifying
the specification. After 10 000 samples, we get a very high confidence in the
satisfaction probability for all benchmarks. These results demonstrate that we
M. Cubuktepe et al.
Table 1. Information for the benchmark instances taken from [32].
Model Information
Satisfaction Probability
benchmark instance ϕ #pars
#states
#trans
sat (1 − ν) unsat (ν)
brp
(256,5) P
2
19 720
26 627
0.055
0.898
(16,5) E
4
1 304
1 731
0.275
0.676
(32,5) E
4
2 600
3 459
0.232
0.718
crowds
(10,5) P
2
104 512
246 082
0.537
0.413
(20,7) P
2
45 421 597 164 432 797
0.416
0.534
nand
(10,5) P
2
35 112
52 647
0.218
0.733
(25,5) P
2
865 592
1 347 047
0.206
0.744
consensus
(2,2)
P
2
272
492
0.280
0.669
(4,2)
P
4
22 656
75 232
0.063
0.888
Table 2. Confidence probabilities αν for different numbers of samples.
Samples
100
1,000
10,000
benchmark instance
αν , sat
αν , unsat
αν , sat
αν , unsat
αν , sat
αν , unsat Time (s)
brp
(256,5) 9.99 · 10
−2 7.02 · 10
−1 1.60 · 10
−2 7.77 · 10
−2 1.12 · 10
−6 3.55 · 10
−6
1761.45
(16,5) 2.72 · 10
−1 1.97 · 10
−1 1.14 · 10
−1 3.36 · 10
−2 5.52 · 10
−6 1.80 · 10
−8
39.76
(32,5) 4.01 · 10
−1 2.95 · 10
−1 1.39 · 10
−1 7.76 · 10
−2 1.24 · 10
−6 2.63 · 10
−6
78.17
crowds
(10,5) 2.57 · 10
−1 3.72 · 10
−1 1.65 · 10
−1 1.16 · 10
−1 9.33 · 10
−7 8.22 · 10
−4
0.19
(20,7) 4.18 · 10
−1 1.38 · 10
−1 2.41 · 10
−1 9.48 · 10
−2 5.81 · 10
−5 2.83 · 10
−5
0.45
nand
(10,5) 3.48 · 10
−1 2.95 · 10
−1 3.64 · 10
−2 3.41 · 10
−1 2.64 · 10
−9 1.48 · 10
−4
144.26
(25,5) 4.42 · 10
−1 3.71 · 10
−1 4.12 · 10
−2 3.78 · 10
−1 3.49 · 10
−6 2.91 · 10
−4
5327.82
consensus
(2,2)
3.38 · 10
−1 3.56 · 10
−1 1.32 · 10
−1 1.32 · 10
−1 5.67 · 10
−7 8.37 · 10
−4
0.72
(4,2)
1.79 · 10
−1 1.41 · 10
−1 6.51 · 10
−2 4.75 · 10
−3 4.26 · 10
−5 9.29 · 10
−8
300.21
percentage of instantiations that do not satisfy the specification (and vice versa
for 1 − ν). We solve Problem 1 and show that the satisfaction probability is
with confidence α ν as least as high as the approximate satisfaction percentages
from [32]. We adapt the Consensus protocol [3] and the Bounded Retransmission
Protocol (brp) [5] to uMDPs; the Crowds Protocol (crowds) [12] and the NAND
Multiplexing benchmark (nand) [8] become uMCs. In Table 1 we list the type of
specification checked (ϕ) and the number of parameters, states, and transitions.
We also list the satisfaction probability (as obtained in [32]) for satisfying (sat)
and falsifying (unsat) the specification ϕ.
Results. Table 2 shows the confidence probability α ν for each benchmark to
satisfy and falsify the specification after 100, 1 000 and 10 000 samples from the
parameter space. In particular, for each number of samples, we report the average
α ν after running 10 full iterations of the same benchmark. Furthermore, we list
the time to solve 1 000 samples for each instance (Time (s)).
The results in Table 2 show that for some benchmarks we get a high confidence
probability already after 1 000 samples. For other benchmarks, the confidence
probability is still considerably low, for instance considering nand and falsifying
the specification. After 10 000 samples, we get a very high confidence in the
satisfaction probability for all benchmarks. These results demonstrate that we