

381
Intel VTune Profiler – Platform Profiler
On Intel systems, you can use the Intel VTune Profiler - Platform Profiler, previously
called VTune Amplifier, (discussed in Chapter 15) to show CPU and memory statistics,
including hit and miss rates of CPU caches and data accesses to DDR and persistent
memory. It can also depict the system’s configuration to show what memory devices are
physically located on which CPU.
IPMCTL Utility
Persistent memory vendor- and server-specific utilities can also be used to show DDR
and persistent memory device topology to help identify what devices are associated
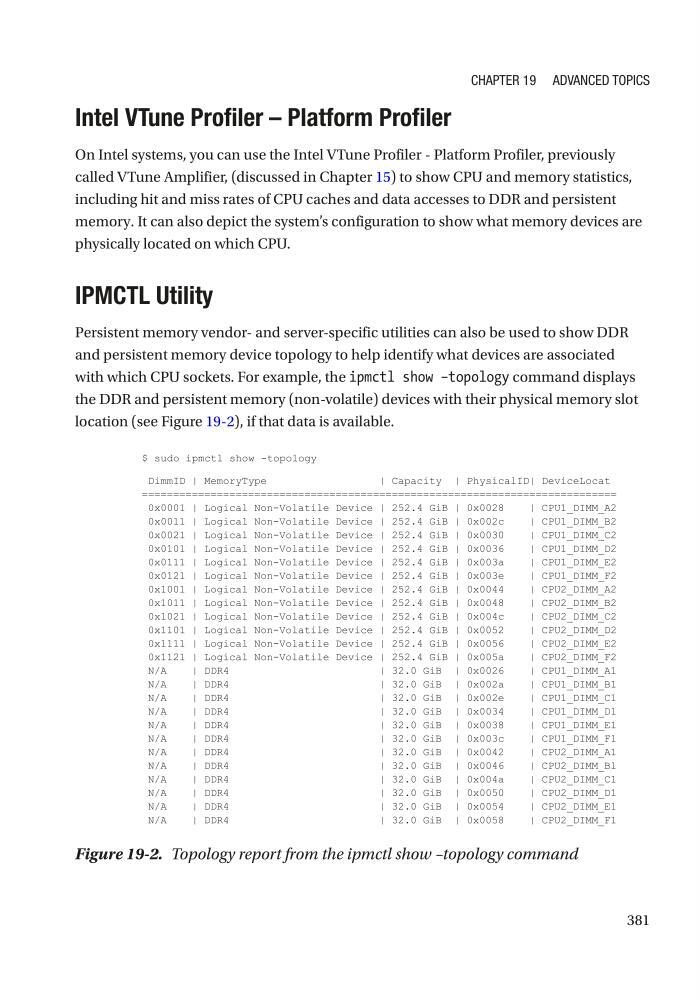
with which CPU sockets. For example, the ipmctl show –topology command displays
the DDR and persistent memory (non-volatile) devices with their physical memory slot
location (see Figure 19-2), if that data is available.
'LPP,'_0HPRU\7\SH_&DSDFLW\_3K\VLFDO,'_'HYLFH/RFDW
[_/RJLFDO1RQ9RODWLOH'HYLFH_*L%_[_&38B',00B$
[_/RJLFDO1RQ9RODWLOH'HYLFH_*L%_[F_&38B',00B%
[_/RJLFDO1RQ9RODWLOH'HYLFH_*L%_[_&38B',00B&
[_/RJLFDO1RQ9RODWLOH'HYLFH_*L%_[_&38B',00B'
[_/RJLFDO1RQ9RODWLOH'HYLFH_*L%_[D_&38B',00B(
[_/RJLFDO1RQ9RODWLOH'HYLFH_*L%_[H_&38B',00B)
[_/RJLFDO1RQ9RODWLOH'HYLFH_*L%_[_&38B',00B$
[_/RJLFDO1RQ9RODWLOH'HYLFH_*L%_[_&38B',00B%
[_/RJLFDO1RQ9RODWLOH'HYLFH_*L%_[F_&38B',00B&
[_/RJLFDO1RQ9RODWLOH'HYLFH_*L%_[_&38B',00B'
[_/RJLFDO1RQ9RODWLOH'HYLFH_*L%_[_&38B',00B(
[_/RJLFDO1RQ9RODWLOH'HYLFH_*L%_[D_&38B',00B)
1$_''5_*L%_[_&38B',00B$
1$_''5_*L%_[D_&38B',00B%
1$_''5
_*L%_[H_&38B',00B&
1$_''5_*L%_[_&38B',00B'
1$_''5_*L%_[_&38B',00B(
1$_''5_*L% _[F_&38B',00B)
1$_''5_*L%_[_&38B',00B$
1$_''5_*L%_[_&38B',00B%
1$_''5_*L%_[D_&38B',00B&
1$_''5_*L%_[_&38B',00B'
1$_''5_*L%_[_&38B',00B(
1$_''5_*L%_[_&38B',00B)
VXGRLSPFWOVKRZWRSRORJ\
Figure 19-2. Topology report from the ipmctl show –topology command
Chapter 19 advanCed topiCs
Intel VTune Profiler – Platform Profiler
On Intel systems, you can use the Intel VTune Profiler - Platform Profiler, previously
called VTune Amplifier, (discussed in Chapter 15) to show CPU and memory statistics,
including hit and miss rates of CPU caches and data accesses to DDR and persistent
memory. It can also depict the system’s configuration to show what memory devices are
physically located on which CPU.
IPMCTL Utility
Persistent memory vendor- and server-specific utilities can also be used to show DDR
and persistent memory device topology to help identify what devices are associated
with which CPU sockets. For example, the ipmctl show –topology command displays
the DDR and persistent memory (non-volatile) devices with their physical memory slot
location (see Figure 19-2), if that data is available.
'LPP,'_0HPRU\7\SH_&DSDFLW\_3K\VLFDO,'_'HYLFH/RFDW
[_/RJLFDO1RQ9RODWLOH'HYLFH_*L%_[_&38B',00B$
[_/RJLFDO1RQ9RODWLOH'HYLFH_*L%_[F_&38B',00B%
[_/RJLFDO1RQ9RODWLOH'HYLFH_*L%_[_&38B',00B&
[_/RJLFDO1RQ9RODWLOH'HYLFH_*L%_[_&38B',00B'
[_/RJLFDO1RQ9RODWLOH'HYLFH_*L%_[D_&38B',00B(
[_/RJLFDO1RQ9RODWLOH'HYLFH_*L%_[H_&38B',00B)
[_/RJLFDO1RQ9RODWLOH'HYLFH_*L%_[_&38B',00B$
[_/RJLFDO1RQ9RODWLOH'HYLFH_*L%_[_&38B',00B%
[_/RJLFDO1RQ9RODWLOH'HYLFH_*L%_[F_&38B',00B&
[_/RJLFDO1RQ9RODWLOH'HYLFH_*L%_[_&38B',00B'
[_/RJLFDO1RQ9RODWLOH'HYLFH_*L%_[_&38B',00B(
[_/RJLFDO1RQ9RODWLOH'HYLFH_*L%_[D_&38B',00B)
1$_''5_*L%_[_&38B',00B$
1$_''5_*L%_[D_&38B',00B%
1$_''5
_*L%_[H_&38B',00B&
1$_''5_*L%_[_&38B',00B'
1$_''5_*L%_[_&38B',00B(
1$_''5_*L% _[F_&38B',00B)
1$_''5_*L%_[_&38B',00B$
1$_''5_*L%_[_&38B',00B%
1$_''5_*L%_[D_&38B',00B&
1$_''5_*L%_[_&38B',00B'
1$_''5_*L%_[_&38B',00B(
1$_''5_*L%_[_&38B',00B)
VXGRLSPFWOVKRZWRSRORJ\
Figure 19-2. Topology report from the ipmctl show –topology command
Chapter 19 advanCed topiCs