

299
to find this information: Memory Consumption analysis or Platform Profiler analysis.
VTune Profiler is a free download for Linux and Windows, available from https://
software.intel.com/en-us/vtune.
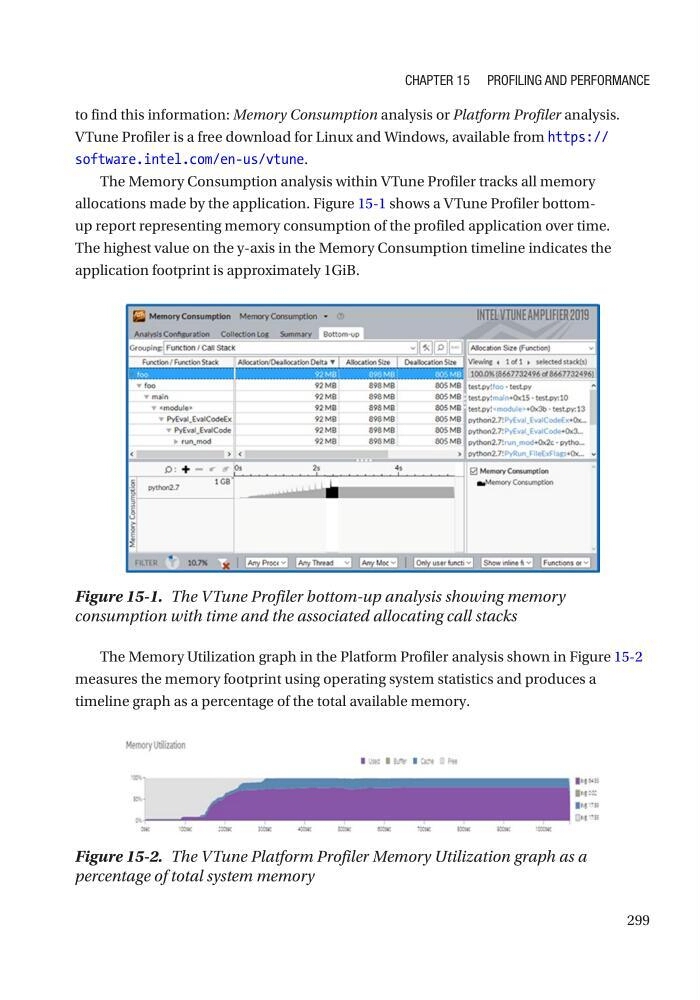
The Memory Consumption analysis within VTune Profiler tracks all memory
allocations made by the application. Figure 15-1 shows a VTune Profiler bottomup report representing memory consumption of the profiled application over time.
The highest value on the y-axis in the Memory Consumption timeline indicates the
application footprint is approximately 1GiB.
The Memory Utilization graph in the Platform Profiler analysis shown in Figure 15- 2
measures the memory footprint using operating system statistics and produces a
timeline graph as a percentage of the total available memory.
Figure 15-1. The VTune Profiler bottom-up analysis showing memory
consumption with time and the associated allocating call stacks
Figure 15-2. The VTune Platform Profiler Memory Utilization graph as a
percentage of total system memory
Chapter 15 profiling and performanCe
to find this information: Memory Consumption analysis or Platform Profiler analysis.
VTune Profiler is a free download for Linux and Windows, available from https://
software.intel.com/en-us/vtune.
The Memory Consumption analysis within VTune Profiler tracks all memory
allocations made by the application. Figure 15-1 shows a VTune Profiler bottomup report representing memory consumption of the profiled application over time.
The highest value on the y-axis in the Memory Consumption timeline indicates the
application footprint is approximately 1GiB.
The Memory Utilization graph in the Platform Profiler analysis shown in Figure 15- 2
measures the memory footprint using operating system statistics and produces a
timeline graph as a percentage of the total available memory.
Figure 15-1. The VTune Profiler bottom-up analysis showing memory
consumption with time and the associated allocating call stacks
Figure 15-2. The VTune Platform Profiler Memory Utilization graph as a
percentage of total system memory
Chapter 15 profiling and performanCe