

225
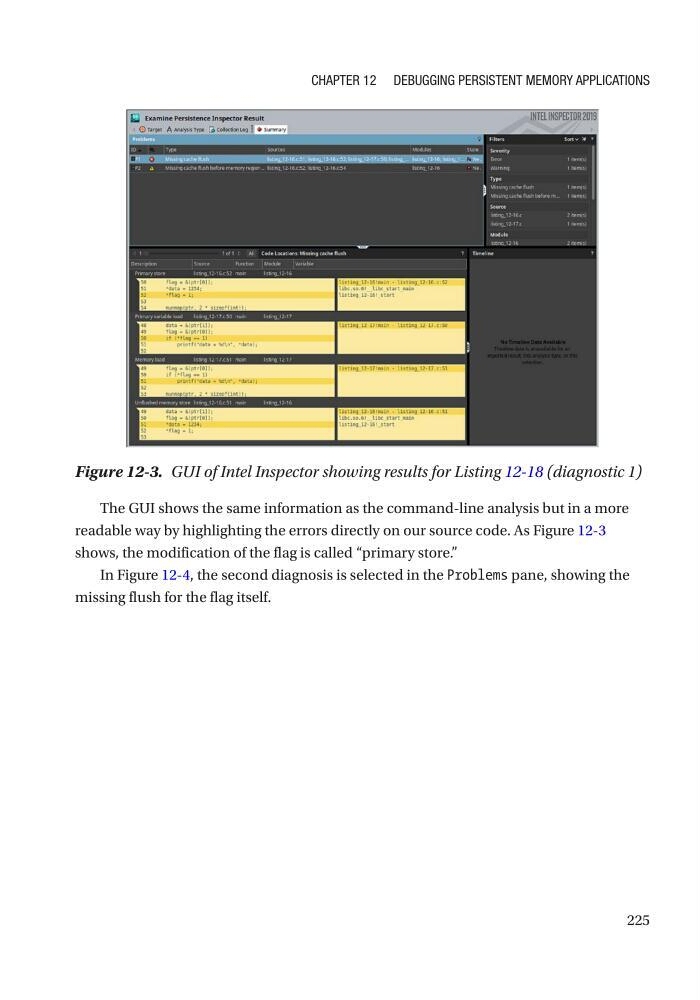
The GUI shows the same information as the command-line analysis but in a more
readable way by highlighting the errors directly on our source code. As Figure 12-3
shows, the modification of the flag is called “primary store.”
In Figure 12-4, the second diagnosis is selected in the Problems pane, showing the
missing flush for the flag itself.
Figure 12-3. GUI of Intel Inspector showing results for Listing 12-18 (diagnostic 1)
Chapter 12 Debugging persistent MeMory appliCations
The GUI shows the same information as the command-line analysis but in a more
readable way by highlighting the errors directly on our source code. As Figure 12-3
shows, the modification of the flag is called “primary store.”
In Figure 12-4, the second diagnosis is selected in the Problems pane, showing the
missing flush for the flag itself.
Figure 12-3. GUI of Intel Inspector showing results for Listing 12-18 (diagnostic 1)
Chapter 12 Debugging persistent MeMory appliCations