

222
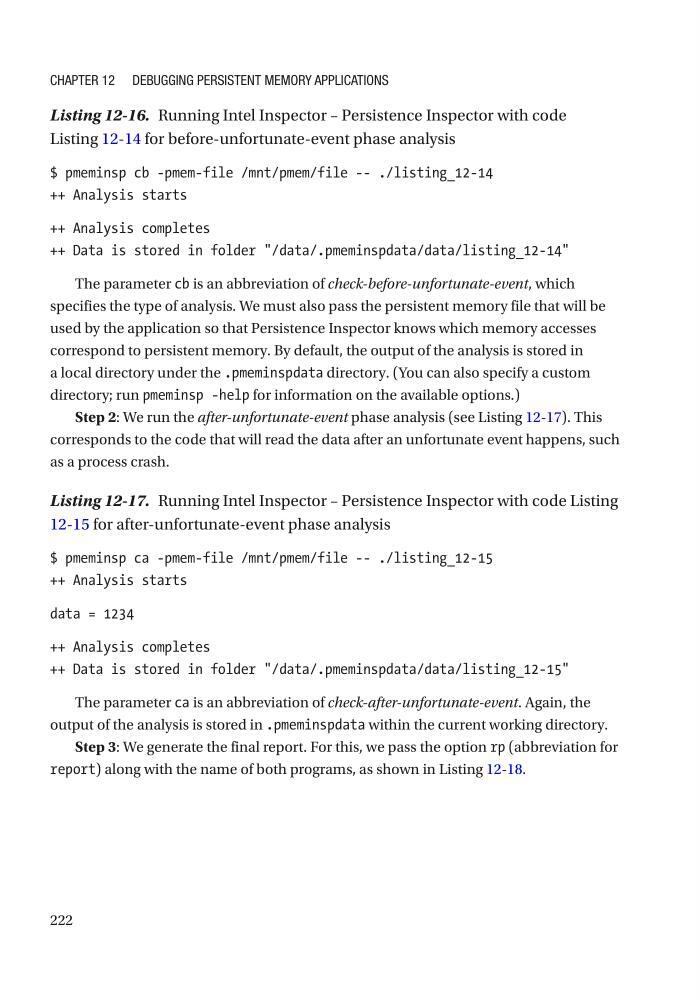
Listing 12-16. Running Intel Inspector – Persistence Inspector with code
Listing 12-14 for before-unfortunate-event phase analysis
$ pmeminsp cb -pmem-file /mnt/pmem/file -- ./listing_12-14
++ Analysis starts
++ Analysis completes
++ Data is stored in folder "/data/.pmeminspdata/data/listing_12-14"
The parameter cb is an abbreviation of check-before-unfortunate-event, which
specifies the type of analysis. We must also pass the persistent memory file that will be
used by the application so that Persistence Inspector knows which memory accesses
correspond to persistent memory. By default, the output of the analysis is stored in
a local directory under the .pmeminspdata directory. (You can also specify a custom
directory; run pmeminsp -help for information on the available options.)
Step 2: We run the after-unfortunate-event phase analysis (see Listing 12-17). This
corresponds to the code that will read the data after an unfortunate event happens, such
as a process crash.
Listing 12-17. Running Intel Inspector – Persistence Inspector with code Listing
12-15 for after-unfortunate-event phase analysis
$ pmeminsp ca -pmem-file /mnt/pmem/file -- ./listing_12-15
++ Analysis starts
data = 1234
++ Analysis completes
++ Data is stored in folder "/data/.pmeminspdata/data/listing_12-15"
The parameter ca is an abbreviation of check-after-unfortunate-event. Again, the
output of the analysis is stored in .pmeminspdata within the current working directory.
Step 3: We generate the final report. For this, we pass the option rp (abbreviation for
report) along with the name of both programs, as shown in Listing 12-18.
Chapter 12 Debugging persistent MeMory appliCations
Listing 12-16. Running Intel Inspector – Persistence Inspector with code
Listing 12-14 for before-unfortunate-event phase analysis
$ pmeminsp cb -pmem-file /mnt/pmem/file -- ./listing_12-14
++ Analysis starts
++ Analysis completes
++ Data is stored in folder "/data/.pmeminspdata/data/listing_12-14"
The parameter cb is an abbreviation of check-before-unfortunate-event, which
specifies the type of analysis. We must also pass the persistent memory file that will be
used by the application so that Persistence Inspector knows which memory accesses
correspond to persistent memory. By default, the output of the analysis is stored in
a local directory under the .pmeminspdata directory. (You can also specify a custom
directory; run pmeminsp -help for information on the available options.)
Step 2: We run the after-unfortunate-event phase analysis (see Listing 12-17). This
corresponds to the code that will read the data after an unfortunate event happens, such
as a process crash.
Listing 12-17. Running Intel Inspector – Persistence Inspector with code Listing
12-15 for after-unfortunate-event phase analysis
$ pmeminsp ca -pmem-file /mnt/pmem/file -- ./listing_12-15
++ Analysis starts
data = 1234
++ Analysis completes
++ Data is stored in folder "/data/.pmeminspdata/data/listing_12-15"
The parameter ca is an abbreviation of check-after-unfortunate-event. Again, the
output of the analysis is stored in .pmeminspdata within the current working directory.
Step 3: We generate the final report. For this, we pass the option rp (abbreviation for
report) along with the name of both programs, as shown in Listing 12-18.
Chapter 12 Debugging persistent MeMory appliCations