

208
describes common persistent memory programming issues and pitfalls and how to
correct them using the tools available. The first half of this chapter introduces the tools.
The second half presents several erroneous programming scenarios and describes how
to use the tools to correct the mistakes before releasing your code into production.
pmemcheck for Valgrind
pmemcheck is a Valgrind (http://www.valgrind.org/) tool developed by Intel. It is very
similar to memcheck, which is the default tool in Valgrind to discover memory-related
bugs but adapted for persistent memory. Valgrind is an instrumentation framework for
building dynamic analysis tools. Some Valgrind tools can automatically detect many
memory management and threading bugs and profile your programs in detail. You can
also use Valgrind to build new tools.
To run pmemcheck, you need a modified version of Valgrind supporting the new
CLFLUSHOPT and CLWB flushing instructions. The persistent memory version of Valgrind
includes the pmemcheck tool and is available from https://github.com/pmem/valgrind.
Refer to the README.md within the GitHub project for installation instructions.
All the libraries in PMDK are already instrumented with pmemcheck. If you use PMDK
for persistent memory programming, you will be able to easily check your code with
pmemcheck without any code modification.
Before we discuss the pmemcheck details, the following two sections demonstrate how
it identifies errors in an out-of-bounds and a memory leak example.
Stack Overflow Example
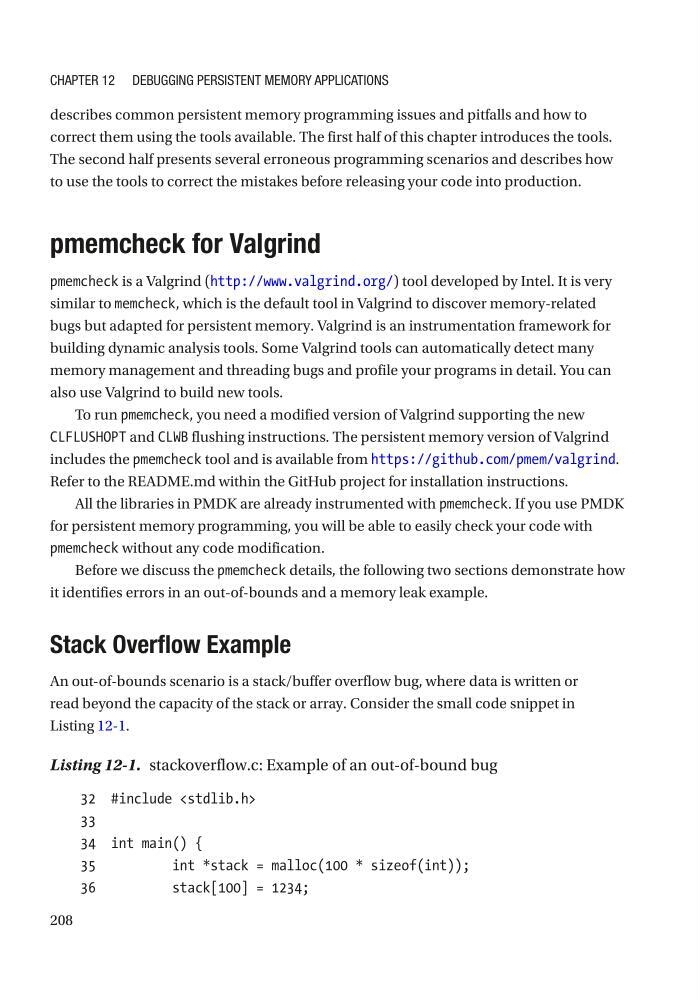
An out-of-bounds scenario is a stack/buffer overflow bug, where data is written or
read beyond the capacity of the stack or array. Consider the small code snippet in
Listing 12-1.
Listing 12-1. stackoverflow.c: Example of an out-of-bound bug
32 #include
33
34 int main() {
35
int *stack = malloc(100 * sizeof(int));
36
stack[100] = 1234;
Chapter 12 Debugging persistent MeMory appliCations
describes common persistent memory programming issues and pitfalls and how to
correct them using the tools available. The first half of this chapter introduces the tools.
The second half presents several erroneous programming scenarios and describes how
to use the tools to correct the mistakes before releasing your code into production.
pmemcheck for Valgrind
pmemcheck is a Valgrind (http://www.valgrind.org/) tool developed by Intel. It is very
similar to memcheck, which is the default tool in Valgrind to discover memory-related
bugs but adapted for persistent memory. Valgrind is an instrumentation framework for
building dynamic analysis tools. Some Valgrind tools can automatically detect many
memory management and threading bugs and profile your programs in detail. You can
also use Valgrind to build new tools.
To run pmemcheck, you need a modified version of Valgrind supporting the new
CLFLUSHOPT and CLWB flushing instructions. The persistent memory version of Valgrind
includes the pmemcheck tool and is available from https://github.com/pmem/valgrind.
Refer to the README.md within the GitHub project for installation instructions.
All the libraries in PMDK are already instrumented with pmemcheck. If you use PMDK
for persistent memory programming, you will be able to easily check your code with
pmemcheck without any code modification.
Before we discuss the pmemcheck details, the following two sections demonstrate how
it identifies errors in an out-of-bounds and a memory leak example.
Stack Overflow Example
An out-of-bounds scenario is a stack/buffer overflow bug, where data is written or
read beyond the capacity of the stack or array. Consider the small code snippet in
Listing 12-1.
Listing 12-1. stackoverflow.c: Example of an out-of-bound bug
32 #include
33
34 int main() {
35
int *stack = malloc(100 * sizeof(int));
36
stack[100] = 1234;
Chapter 12 Debugging persistent MeMory appliCations