

Measuring the Dynamics of Mammalian Societies
377
Meelis (1992) recommend: performing a global inspection of bar plots to
ensure stationarity, testing the bout lengths of all acts in the ethogram for
exponentiality (e.g., Darling’s test), using cumulative bout length plots and the
likelihood ratio change point test to reveal deviations from exponentiality
attributable to lack of stationarity, and devising a rational basis (in the case of
nose-to-nose in wood mice, lag sequential analysis) on which to split problematic categories into new robust categories. Other methods of splitting the
behavior according to the bouts are based on fitting a nonlinear curve to the
logarithm of the observed frequencies of gap lengths (Sibly et al. 1990) and on
the use of likelihood ratio tests in helping to determine whether the data occur
in bouts (Langton et al. 1995).
However, it is important that the statistical procedure does not obscure
biological insight, so the new, split categories must make sense. For example,
it is clearly sensible to split the instances of follow-B (individual B) that were
preceded by fight from those preceded by copulation or intromission because
both new categories of follow (A, B) have different contextual functions and,
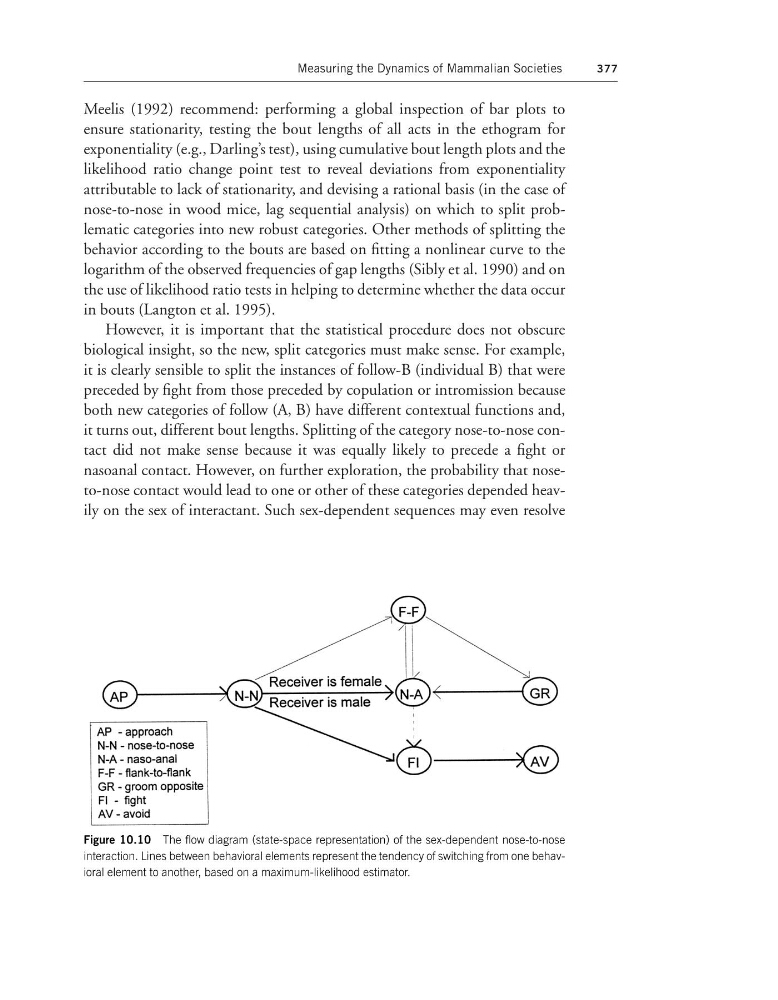
it turns out, different bout lengths. Splitting of the category nose-to-nose contact did not make sense because it was equally likely to precede a fight or
nasoanal contact. However, on further exploration, the probability that noseto-nose contact would lead to one or other of these categories depended heavily on the sex of interactant. Such sex-dependent sequences may even resolve
Figure 10.10 The flow diagram (state-space representation) of the sex-dependent nose-to-nose
interaction. Lines between behavioral elements represent the tendency of switching from one behavioral element to another, based on a maximum-likelihood estimator.
377
Meelis (1992) recommend: performing a global inspection of bar plots to
ensure stationarity, testing the bout lengths of all acts in the ethogram for
exponentiality (e.g., Darling’s test), using cumulative bout length plots and the
likelihood ratio change point test to reveal deviations from exponentiality
attributable to lack of stationarity, and devising a rational basis (in the case of
nose-to-nose in wood mice, lag sequential analysis) on which to split problematic categories into new robust categories. Other methods of splitting the
behavior according to the bouts are based on fitting a nonlinear curve to the
logarithm of the observed frequencies of gap lengths (Sibly et al. 1990) and on
the use of likelihood ratio tests in helping to determine whether the data occur
in bouts (Langton et al. 1995).
However, it is important that the statistical procedure does not obscure
biological insight, so the new, split categories must make sense. For example,
it is clearly sensible to split the instances of follow-B (individual B) that were
preceded by fight from those preceded by copulation or intromission because
both new categories of follow (A, B) have different contextual functions and,
it turns out, different bout lengths. Splitting of the category nose-to-nose contact did not make sense because it was equally likely to precede a fight or
nasoanal contact. However, on further exploration, the probability that noseto-nose contact would lead to one or other of these categories depended heavily on the sex of interactant. Such sex-dependent sequences may even resolve
Figure 10.10 The flow diagram (state-space representation) of the sex-dependent nose-to-nose
interaction. Lines between behavioral elements represent the tendency of switching from one behavioral element to another, based on a maximum-likelihood estimator.