

Measuring the Dynamics of Mammalian Societies
375
α
AB
= ᎏ
N
N
A
A
B
B
ᎏ
(10.2)
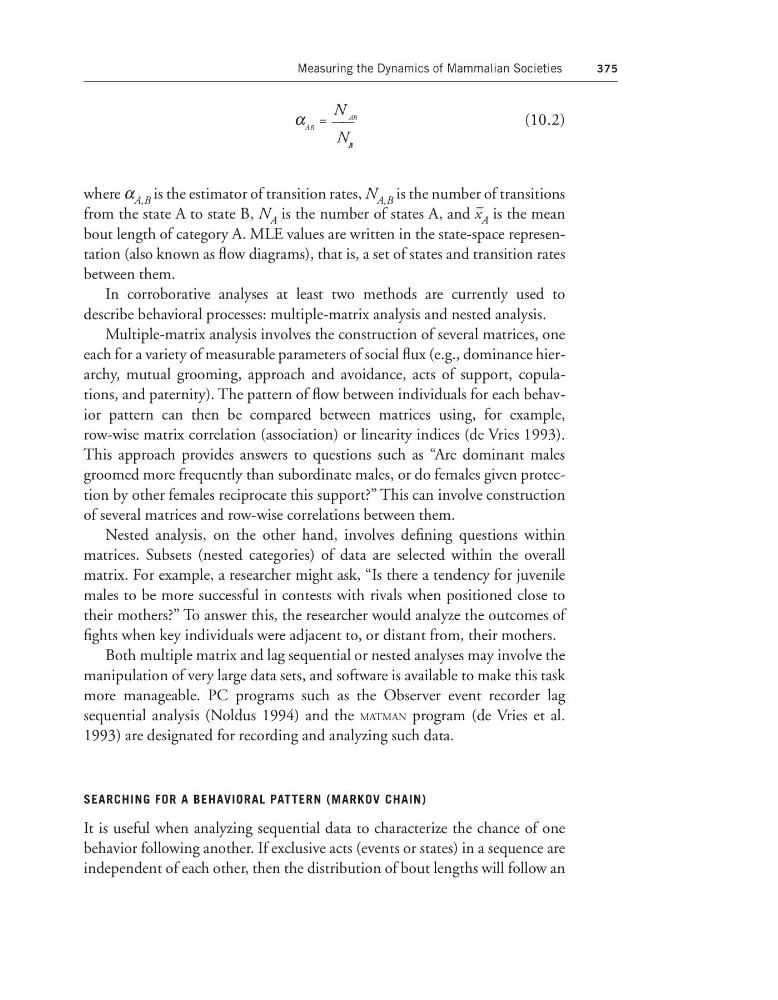
where α A,B is the estimator of transition rates, N A,B is the number of transitions
from the state A to state B, N A is the number of states A, and x ෆA is the mean
bout length of category A. MLE values are written in the state-space representation (also known as flow diagrams), that is, a set of states and transition rates
between them.
In corroborative analyses at least two methods are currently used to
describe behavioral processes: multiple-matrix analysis and nested analysis.
Multiple-matrix analysis involves the construction of several matrices, one
each for a variety of measurable parameters of social flux (e.g., dominance hierarchy, mutual grooming, approach and avoidance, acts of support, copulations, and paternity). The pattern of flow between individuals for each behavior pattern can then be compared between matrices using, for example,
row-wise matrix correlation (association) or linearity indices (de Vries 1993).
This approach provides answers to questions such as “Are dominant males
groomed more frequently than subordinate males, or do females given protection by other females reciprocate this support?” This can involve construction
of several matrices and row-wise correlations between them.
Nested analysis, on the other hand, involves defining questions within
matrices. Subsets (nested categories) of data are selected within the overall
matrix. For example, a researcher might ask, “Is there a tendency for juvenile
males to be more successful in contests with rivals when positioned close to
their mothers?” To answer this, the researcher would analyze the outcomes of
fights when key individuals were adjacent to, or distant from, their mothers.
Both multiple matrix and lag sequential or nested analyses may involve the
manipulation of very large data sets, and software is available to make this task
more manageable. PC programs such as the Observer event recorder lag
sequential analysis (Noldus 1994) and the MATMAN program (de Vries et al.
1993) are designated for recording and analyzing such data.
SEARCHING FOR A BEHAVIORAL PATTERN (MARKOV CHAIN)
It is useful when analyzing sequential data to characterize the chance of one
behavior following another. If exclusive acts (events or states) in a sequence are
independent of each other, then the distribution of bout lengths will follow an
375
α
AB
= ᎏ
N
N
A
A
B
B
ᎏ
(10.2)
where α A,B is the estimator of transition rates, N A,B is the number of transitions
from the state A to state B, N A is the number of states A, and x ෆA is the mean
bout length of category A. MLE values are written in the state-space representation (also known as flow diagrams), that is, a set of states and transition rates
between them.
In corroborative analyses at least two methods are currently used to
describe behavioral processes: multiple-matrix analysis and nested analysis.
Multiple-matrix analysis involves the construction of several matrices, one
each for a variety of measurable parameters of social flux (e.g., dominance hierarchy, mutual grooming, approach and avoidance, acts of support, copulations, and paternity). The pattern of flow between individuals for each behavior pattern can then be compared between matrices using, for example,
row-wise matrix correlation (association) or linearity indices (de Vries 1993).
This approach provides answers to questions such as “Are dominant males
groomed more frequently than subordinate males, or do females given protection by other females reciprocate this support?” This can involve construction
of several matrices and row-wise correlations between them.
Nested analysis, on the other hand, involves defining questions within
matrices. Subsets (nested categories) of data are selected within the overall
matrix. For example, a researcher might ask, “Is there a tendency for juvenile
males to be more successful in contests with rivals when positioned close to
their mothers?” To answer this, the researcher would analyze the outcomes of
fights when key individuals were adjacent to, or distant from, their mothers.
Both multiple matrix and lag sequential or nested analyses may involve the
manipulation of very large data sets, and software is available to make this task
more manageable. PC programs such as the Observer event recorder lag
sequential analysis (Noldus 1994) and the MATMAN program (de Vries et al.
1993) are designated for recording and analyzing such data.
SEARCHING FOR A BEHAVIORAL PATTERN (MARKOV CHAIN)
It is useful when analyzing sequential data to characterize the chance of one
behavior following another. If exclusive acts (events or states) in a sequence are
independent of each other, then the distribution of bout lengths will follow an