

Measuring the Dynamics of Mammalian Societies
357
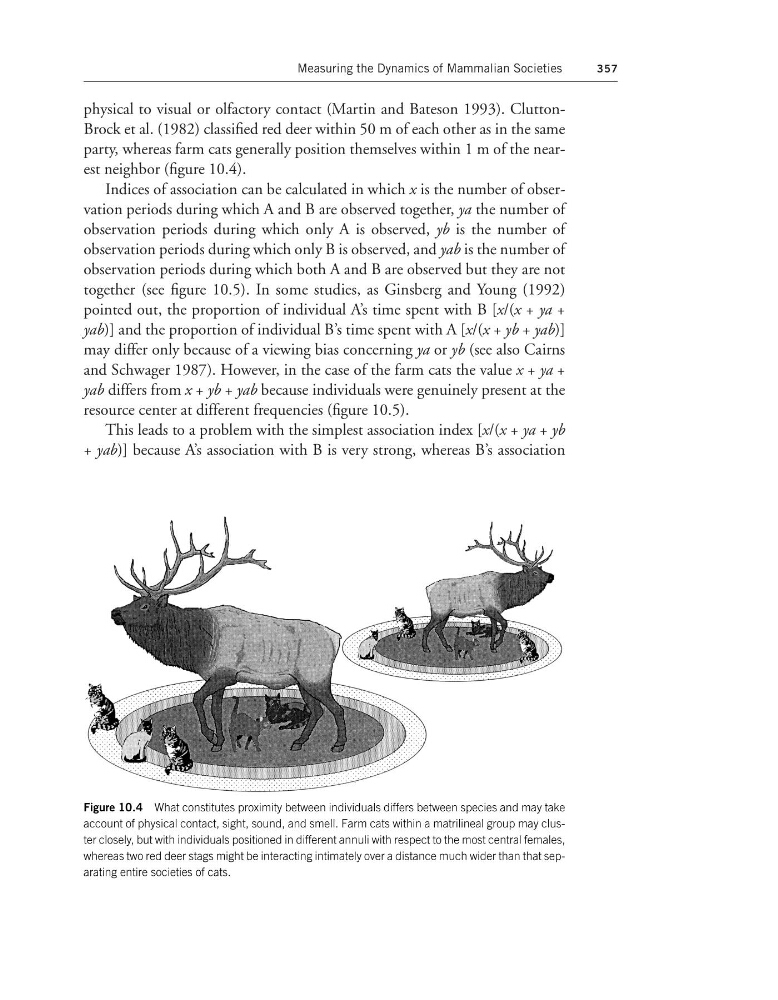
physical to visual or olfactory contact (Martin and Bateson 1993). CluttonBrock et al. (1982) classified red deer within 50 m of each other as in the same
party, whereas farm cats generally position themselves within 1 m of the nearest neighbor (figure 10.4).
Indices of association can be calculated in which x is the number of observation periods during which A and B are observed together, ya the number of
observation periods during which only A is observed, yb is the number of
observation periods during which only B is observed, and yab is the number of
observation periods during which both A and B are observed but they are not
together (see figure 10.5). In some studies, as Ginsberg and Young (1992)
pointed out, the proportion of individual A’s time spent with B [x/(x + ya +
yab)] and the proportion of individual B’s time spent with A [x/(x + yb + yab)]
may differ only because of a viewing bias concerning ya or yb (see also Cairns
and Schwager 1987). However, in the case of the farm cats the value x + ya +
yab differs from x + yb + yab because individuals were genuinely present at the
resource center at different frequencies (figure 10.5).
This leads to a problem with the simplest association index [x/(x + ya + yb
+ yab)] because A’s association with B is very strong, whereas B’s association
Figure 10.4 What constitutes proximity between individuals differs between species and may take
account of physical contact, sight, sound, and smell. Farm cats within a matrilineal group may cluster closely, but with individuals positioned in different annuli with respect to the most central females,
whereas two red deer stags might be interacting intimately over a distance much wider than that separating entire societies of cats.
357
physical to visual or olfactory contact (Martin and Bateson 1993). CluttonBrock et al. (1982) classified red deer within 50 m of each other as in the same
party, whereas farm cats generally position themselves within 1 m of the nearest neighbor (figure 10.4).
Indices of association can be calculated in which x is the number of observation periods during which A and B are observed together, ya the number of
observation periods during which only A is observed, yb is the number of
observation periods during which only B is observed, and yab is the number of
observation periods during which both A and B are observed but they are not
together (see figure 10.5). In some studies, as Ginsberg and Young (1992)
pointed out, the proportion of individual A’s time spent with B [x/(x + ya +
yab)] and the proportion of individual B’s time spent with A [x/(x + yb + yab)]
may differ only because of a viewing bias concerning ya or yb (see also Cairns
and Schwager 1987). However, in the case of the farm cats the value x + ya +
yab differs from x + yb + yab because individuals were genuinely present at the
resource center at different frequencies (figure 10.5).
This leads to a problem with the simplest association index [x/(x + ya + yb
+ yab)] because A’s association with B is very strong, whereas B’s association
Figure 10.4 What constitutes proximity between individuals differs between species and may take
account of physical contact, sight, sound, and smell. Farm cats within a matrilineal group may cluster closely, but with individuals positioned in different annuli with respect to the most central females,
whereas two red deer stags might be interacting intimately over a distance much wider than that separating entire societies of cats.