

Population Viability Analysis
311
Therefore, all we have to do is manipulate this equation with a value of σ 2 to
obtain an estimator of σ 2 .
To obtain a confidence interval on the estimator of σ 2 , we can substitute
the appropriate chi-square values in this relationship. To find the upper confidence interval value, σ 2
U solve the equation
ᎏ
10 – 1
ᎏ =
and for the lower confidence interval value, σ 2
L solve the equation
ᎏ
10
–
1
ᎏ = ᎏ
χ
1
2
0
10
–
–1,
1
α U
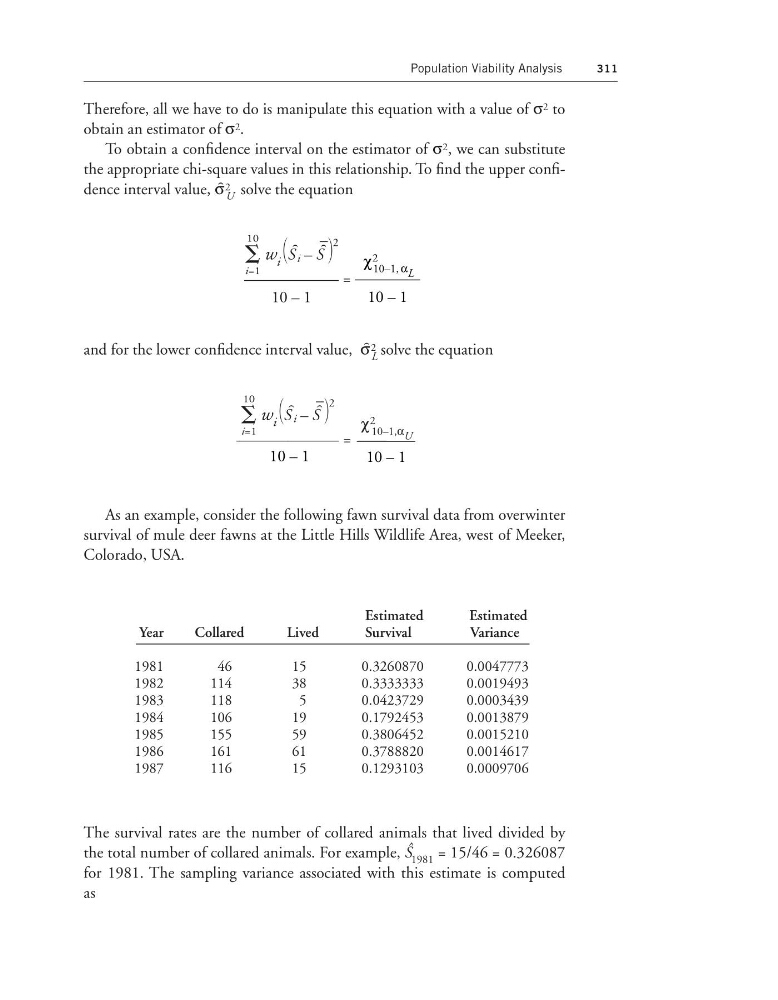
As an example, consider the following fawn survival data from overwinter
survival of mule deer fawns at the Little Hills Wildlife Area, west of Meeker,
Colorado, USA.
Estimated
Estimated
Year
Collared
Lived
Survival
Variance
1981
46
15
0.3260870
0.0047773
1982
114
38
0.3333333
0.0019493
1983
118
5
0.0423729
0.0003439
1984
106
19
0.1792453
0.0013879
1985
155
59
0.3806452
0.0015210
1986
161
61
0.3788820
0.0014617
1987
116
15
0.1293103
0.0009706
The survival rates are the number of collared animals that lived divided by
the total number of collared animals. For example, S ˆ
1981 = 15/46 = 0.326087
for 1981. The sampling variance associated with this estimate is computed
as
⌺
10
i=1
w i S i – S
–
2
⌺
10
i=1
w i S i – S
–
2
10 – 1
10 – 1
10 – 1
χ 2
10–1, α L
311
Therefore, all we have to do is manipulate this equation with a value of σ 2 to
obtain an estimator of σ 2 .
To obtain a confidence interval on the estimator of σ 2 , we can substitute
the appropriate chi-square values in this relationship. To find the upper confidence interval value, σ 2
U solve the equation
ᎏ
10 – 1
ᎏ =
and for the lower confidence interval value, σ 2
L solve the equation
ᎏ
10
–
1
ᎏ = ᎏ
χ
1
2
0
10
–
–1,
1
α U
As an example, consider the following fawn survival data from overwinter
survival of mule deer fawns at the Little Hills Wildlife Area, west of Meeker,
Colorado, USA.
Estimated
Estimated
Year
Collared
Lived
Survival
Variance
1981
46
15
0.3260870
0.0047773
1982
114
38
0.3333333
0.0019493
1983
118
5
0.0423729
0.0003439
1984
106
19
0.1792453
0.0013879
1985
155
59
0.3806452
0.0015210
1986
161
61
0.3788820
0.0014617
1987
116
15
0.1293103
0.0009706
The survival rates are the number of collared animals that lived divided by
the total number of collared animals. For example, S ˆ
1981 = 15/46 = 0.326087
for 1981. The sampling variance associated with this estimate is computed
as
⌺
10
i=1
w i S i – S
–
2
⌺
10
i=1
w i S i – S
–
2
10 – 1
10 – 1
10 – 1
χ 2
10–1, α L