

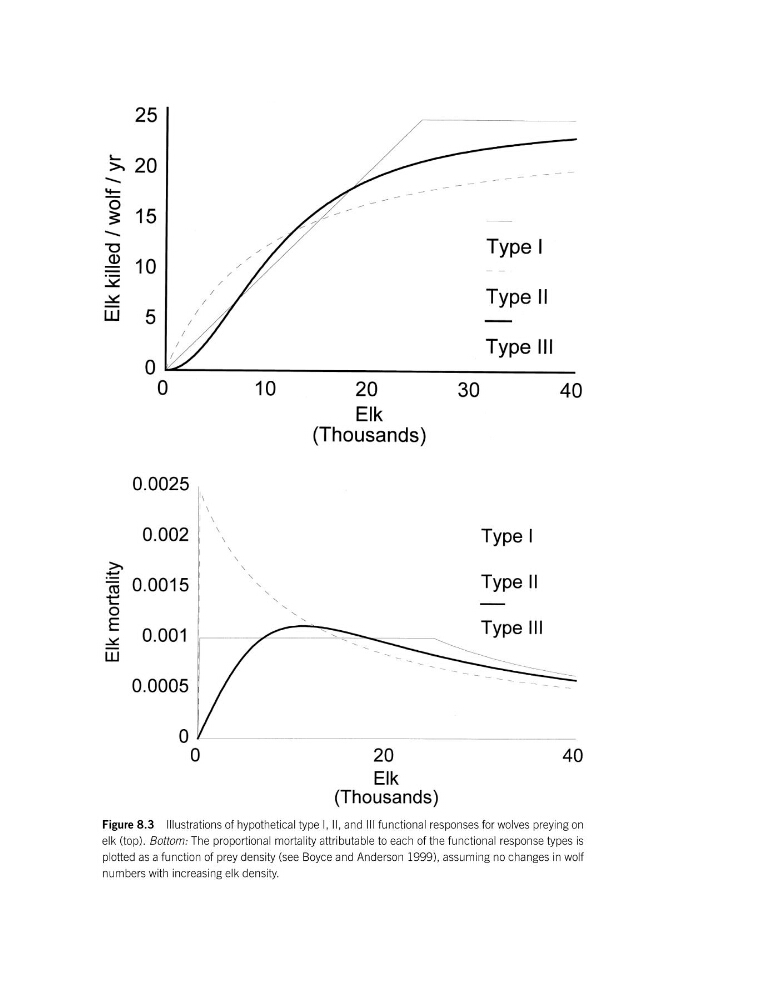
Figure 8.3 Illustrations of hypothetical type I, II, and III functional responses for wolves preying on
elk (top). Bottom: The proportional mortality attributable to each of the functional response types is
plotted as a function of prey density (see Boyce and Anderson 1999), assuming no changes in wolf
numbers with increasing elk density.
elk (top). Bottom: The proportional mortality attributable to each of the functional response types is
plotted as a function of prey density (see Boyce and Anderson 1999), assuming no changes in wolf
numbers with increasing elk density.