

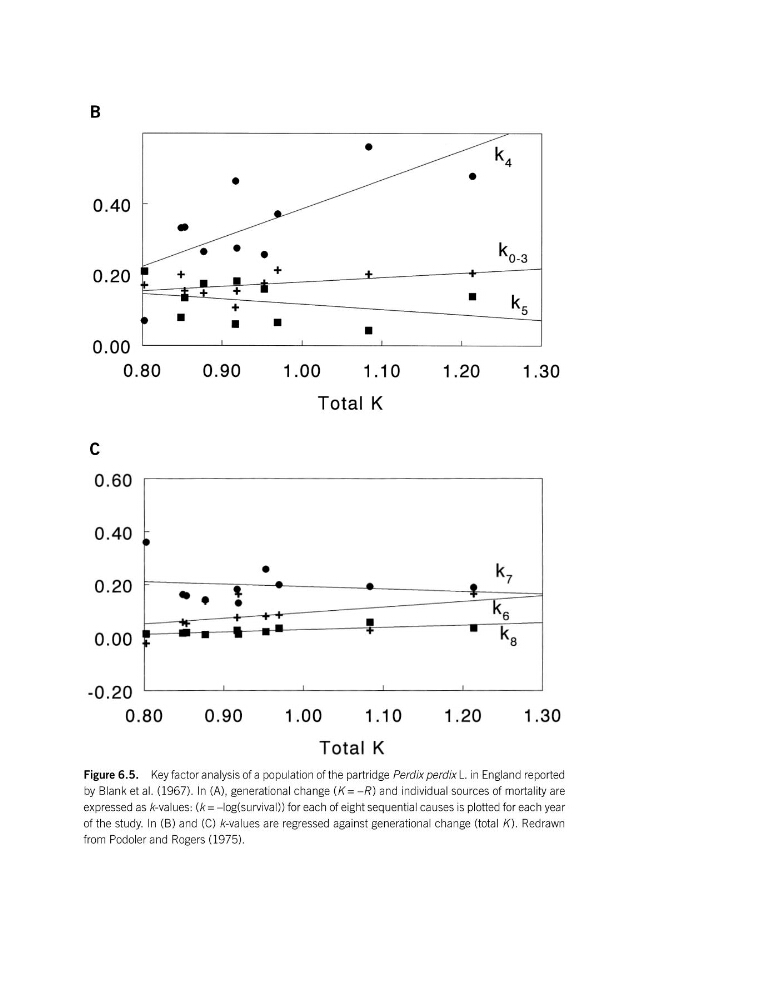
Figure 6.5. Key factor analysis of a population of the partridge Perdix perdix L. in England reported
by Blank et al. (1967). In (A), generational change (K = –R) and individual sources of mortality are
expressed as k-values: (k = –log(survival)) for each of eight sequential causes is plotted for each year
of the study. In (B) and (C) k-values are regressed against generational change (total K ). Redrawn
from Podoler and Rogers (1975).
B
C
by Blank et al. (1967). In (A), generational change (K = –R) and individual sources of mortality are
expressed as k-values: (k = –log(survival)) for each of eight sequential causes is plotted for each year
of the study. In (B) and (C) k-values are regressed against generational change (total K ). Redrawn
from Podoler and Rogers (1975).
B
C