

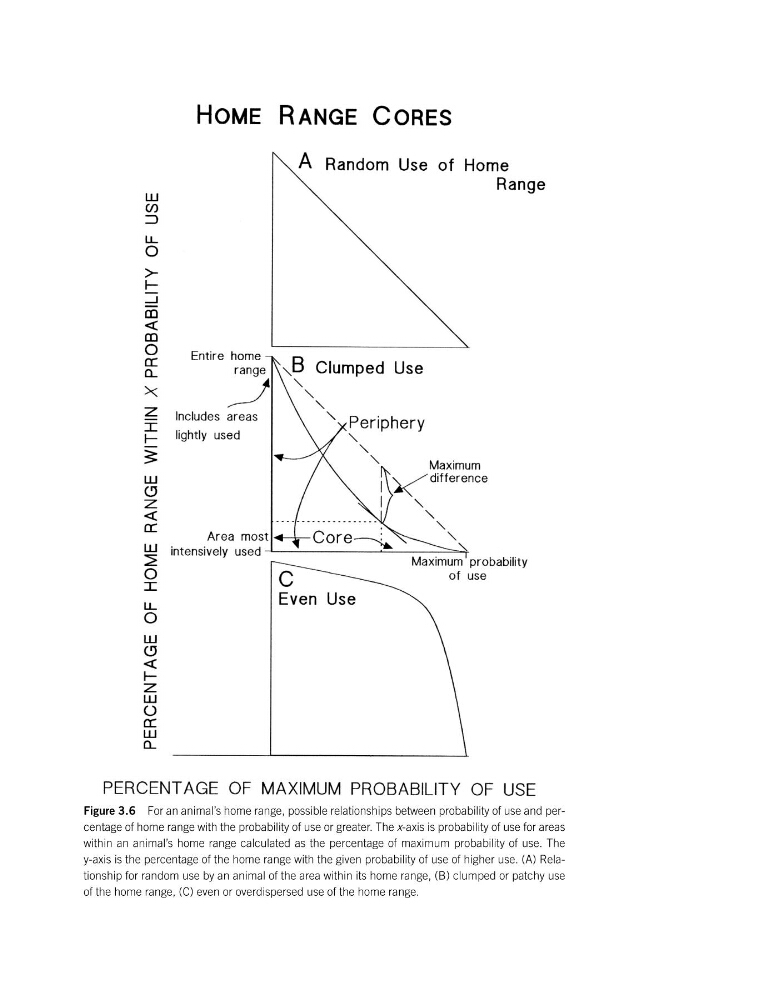
Figure 3.6 For an animal’s home range, possible relationships between probability of use and percentage of home range with the probability of use or greater. The x-axis is probability of use for areas
within an animal’s home range calculated as the percentage of maximum probability of use. The
y-axis is the percentage of the home range with the given probability of use of higher use. (A) Relationship for random use by an animal of the area within its home range, (B) clumped or patchy use
of the home range, (C) even or overdispersed use of the home range.
within an animal’s home range calculated as the percentage of maximum probability of use. The
y-axis is the percentage of the home range with the given probability of use of higher use. (A) Relationship for random use by an animal of the area within its home range, (B) clumped or patchy use
of the home range, (C) even or overdispersed use of the home range.