

49
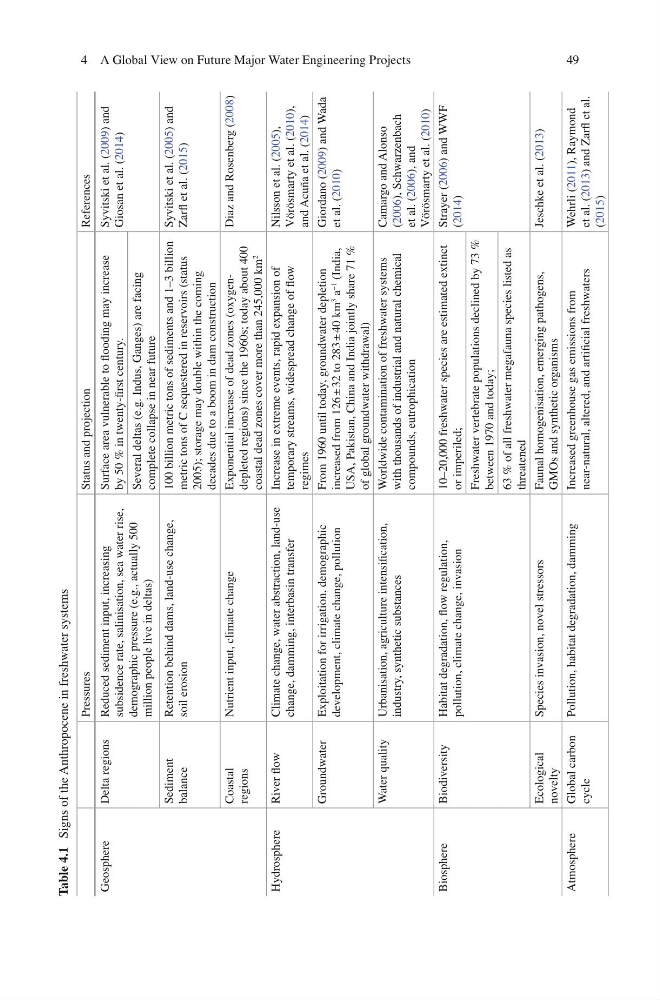
Table 4.1
Signs of the Anthropocene in freshwater systems
Pressures
Status and projection
References
Geosphere
Delta regions
Reduced sediment input, increasing
subsidence rate, salinisation, sea water rise,
demographic pressure (e.g., actually 500
million people live in deltas)
Surface area vulnerable to fl ooding may increase
by 50 % in twenty-fi rst century.
Syvitski et al. (
2009 ) and
Giosan et al. ( 2014 )
Several deltas (e.g. Indus, Ganges) are facing
complete collapse in near future
Sediment
balance
Retention behind dams, land-use change,
soil erosion
100 billion metric tons of sediments and 1–3 billion
metric tons of C sequestered in reservoirs (status
2005); storage may double within the coming
decades due to a boom in dam construction
Syvitski et al. ( 2005 ) and
Zarfl et al. ( 2015 )
Coastal
regions
Nutrient input, climate change
Exponential increase of dead zones (oxygendepleted regions) since the 1960s; today about 400
coastal dead zones cover more than 245,000 km
2
Diaz and Rosenberg ( 2008 )
Hydrosphere
River fl ow
Climate change, water abstraction, land-use
change, damming, interbasin transfer
Increase in extreme events, rapid expansion of
temporary streams, widespread change of fl ow
regimes
Nilsson et al. ( 2005 ),
Vörösmarty et al. ( 2010 ),
and Acuña et al. ( 2014 )
Groundwater
Exploitation for irrigation, demographic
development, climate change, pollution
From 1960 until today, groundwater depletion
increased from 126 ± 32 to 283 ± 40 km
3
a
−1
(India,
USA, Pakistan, China and India jointly share 71 %
of global groundwater withdrawal)
Giordano ( 2009 ) and Wada
et al. ( 2010 )
Water quality
Urbanisation, agriculture intensifi cation,
industry, synthetic substances
Worldwide contamination of freshwater systems
with thousands of industrial and natural chemical
compounds, eutrophication
Camargo and Alonso
( 2006 ), Schwarzenbach
et al. ( 2006 ), and
Vörösmarty et al. ( 2010 )
Biosphere
Biodiversity
Habitat degradation, fl ow regulation,
pollution, climate change, invasion
10–20,000 freshwater species are estimated extinct
or imperiled;
Strayer ( 2006 ) and WWF
( 2014 )
Freshwater vertebrate populations declined by 73 %
between 1970 and today;
63 % of all freshwater megafauna species listed as
threatened
Ecological
novelty
Species invasion, novel stressors
Faunal homogenisation, emerging pathogens,
GMOs and synthetic organisms
Jeschke et al. ( 2013 )
Atmosphere
Global carbon
cycle
Pollution, habitat degradation, damming
Increased greenhouse gas emissions from
near-natural, altered, and artifi cial freshwaters
Wehrli ( 2011 ), Raymond
et al. ( 2013 ) and Zarfl et al.
( 2015 )
4 A Global View on Future Major Water Engineering Projects
Table 4.1
Signs of the Anthropocene in freshwater systems
Pressures
Status and projection
References
Geosphere
Delta regions
Reduced sediment input, increasing
subsidence rate, salinisation, sea water rise,
demographic pressure (e.g., actually 500
million people live in deltas)
Surface area vulnerable to fl ooding may increase
by 50 % in twenty-fi rst century.
Syvitski et al. (
2009 ) and
Giosan et al. ( 2014 )
Several deltas (e.g. Indus, Ganges) are facing
complete collapse in near future
Sediment
balance
Retention behind dams, land-use change,
soil erosion
100 billion metric tons of sediments and 1–3 billion
metric tons of C sequestered in reservoirs (status
2005); storage may double within the coming
decades due to a boom in dam construction
Syvitski et al. ( 2005 ) and
Zarfl et al. ( 2015 )
Coastal
regions
Nutrient input, climate change
Exponential increase of dead zones (oxygendepleted regions) since the 1960s; today about 400
coastal dead zones cover more than 245,000 km
2
Diaz and Rosenberg ( 2008 )
Hydrosphere
River fl ow
Climate change, water abstraction, land-use
change, damming, interbasin transfer
Increase in extreme events, rapid expansion of
temporary streams, widespread change of fl ow
regimes
Nilsson et al. ( 2005 ),
Vörösmarty et al. ( 2010 ),
and Acuña et al. ( 2014 )
Groundwater
Exploitation for irrigation, demographic
development, climate change, pollution
From 1960 until today, groundwater depletion
increased from 126 ± 32 to 283 ± 40 km
3
a
−1
(India,
USA, Pakistan, China and India jointly share 71 %
of global groundwater withdrawal)
Giordano ( 2009 ) and Wada
et al. ( 2010 )
Water quality
Urbanisation, agriculture intensifi cation,
industry, synthetic substances
Worldwide contamination of freshwater systems
with thousands of industrial and natural chemical
compounds, eutrophication
Camargo and Alonso
( 2006 ), Schwarzenbach
et al. ( 2006 ), and
Vörösmarty et al. ( 2010 )
Biosphere
Biodiversity
Habitat degradation, fl ow regulation,
pollution, climate change, invasion
10–20,000 freshwater species are estimated extinct
or imperiled;
Strayer ( 2006 ) and WWF
( 2014 )
Freshwater vertebrate populations declined by 73 %
between 1970 and today;
63 % of all freshwater megafauna species listed as
threatened
Ecological
novelty
Species invasion, novel stressors
Faunal homogenisation, emerging pathogens,
GMOs and synthetic organisms
Jeschke et al. ( 2013 )
Atmosphere
Global carbon
cycle
Pollution, habitat degradation, damming
Increased greenhouse gas emissions from
near-natural, altered, and artifi cial freshwaters
Wehrli ( 2011 ), Raymond
et al. ( 2013 ) and Zarfl et al.
( 2015 )
4 A Global View on Future Major Water Engineering Projects