

13.3.1 Neutron Flux Distribution
Neutron flux distribution is drastically changed with the change in subcriticality of
the system, because of the change in the number of fuel rods in the core. Figures 13.2, 13.3, and 13.4 show the neutron flux distribution along the central line
from T-target to core for 13 fuel rods case in eigenvalue mode and time-dependent
mode, respectively. Neutron flux distribution evaluated in time-dependent mode
changes as a function of elapsed time after the injection of D-T neutrons, and the
shape of neutron flux distribution is almost stable after 1e
À4 s (Figs. 13.3 and 13.4).
The comparison of neutron flux between two modes shows the discrepancy
(Figs. 13.5 and 13.6). Thermal neutron flux distribution of the time-dependent
mode is smaller at fuel region, but higher at the reflector region, than those of
eigenvalue mode, although fast neutron flux distribution is almost the same between
the two modes. Figures 13.5 and 13.6 also show that the neutron spectrum is
different between two modes, and the details are discussed in the next section.
13.3.2 Neutron Spectrum
The neutron spectrum at the fuel region is shown in Figs. 13.7 and 13.8. The neutron
spectrum in time-dependent mode changes as a function of elapsed time, although
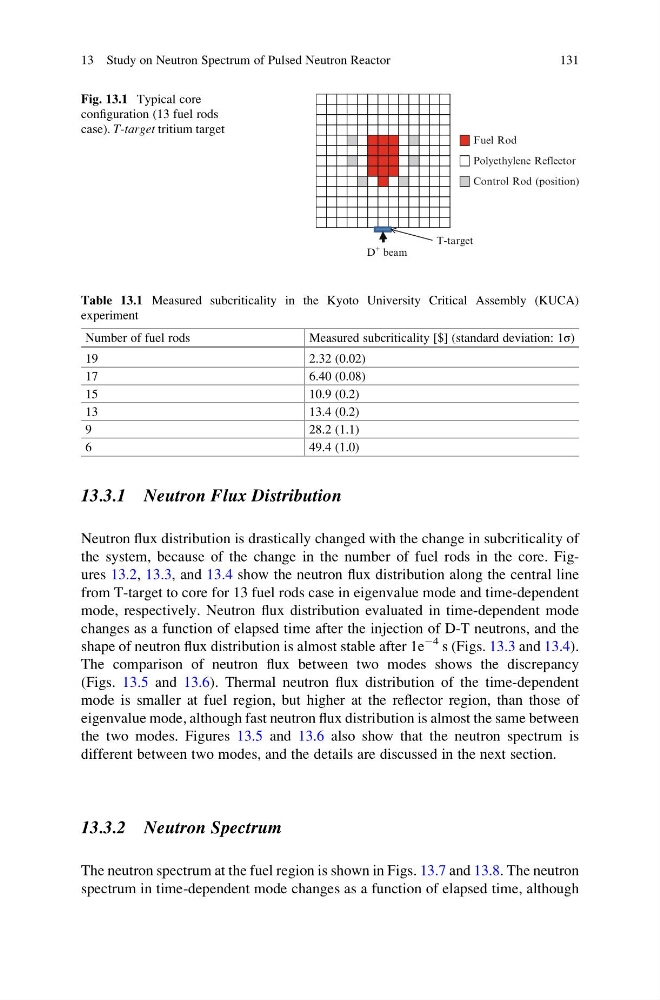
Fuel Rod
Polyethylene Reflector
Control Rod (position)
T-target
D
+ beam
Fig. 13.1 Typical core
configuration (13 fuel rods
case). T-target tritium target
Table 13.1 Measured subcriticality in the Kyoto University Critical Assembly (KUCA)
experiment
Number of fuel rods
Measured subcriticality [$] (standard deviation: 1σ)
19
2.32 (0.02)
17
6.40 (0.08)
15
10.9 (0.2)
13
13.4 (0.2)
9
28.2 (1.1)
6
49.4 (1.0)
13 Study on Neutron Spectrum of Pulsed Neutron Reactor
131
Neutron flux distribution is drastically changed with the change in subcriticality of
the system, because of the change in the number of fuel rods in the core. Figures 13.2, 13.3, and 13.4 show the neutron flux distribution along the central line
from T-target to core for 13 fuel rods case in eigenvalue mode and time-dependent
mode, respectively. Neutron flux distribution evaluated in time-dependent mode
changes as a function of elapsed time after the injection of D-T neutrons, and the
shape of neutron flux distribution is almost stable after 1e
À4 s (Figs. 13.3 and 13.4).
The comparison of neutron flux between two modes shows the discrepancy
(Figs. 13.5 and 13.6). Thermal neutron flux distribution of the time-dependent
mode is smaller at fuel region, but higher at the reflector region, than those of
eigenvalue mode, although fast neutron flux distribution is almost the same between
the two modes. Figures 13.5 and 13.6 also show that the neutron spectrum is
different between two modes, and the details are discussed in the next section.
13.3.2 Neutron Spectrum
The neutron spectrum at the fuel region is shown in Figs. 13.7 and 13.8. The neutron
spectrum in time-dependent mode changes as a function of elapsed time, although
Fuel Rod
Polyethylene Reflector
Control Rod (position)
T-target
D
+ beam
Fig. 13.1 Typical core
configuration (13 fuel rods
case). T-target tritium target
Table 13.1 Measured subcriticality in the Kyoto University Critical Assembly (KUCA)
experiment
Number of fuel rods
Measured subcriticality [$] (standard deviation: 1σ)
19
2.32 (0.02)
17
6.40 (0.08)
15
10.9 (0.2)
13
13.4 (0.2)
9
28.2 (1.1)
6
49.4 (1.0)
13 Study on Neutron Spectrum of Pulsed Neutron Reactor
131