

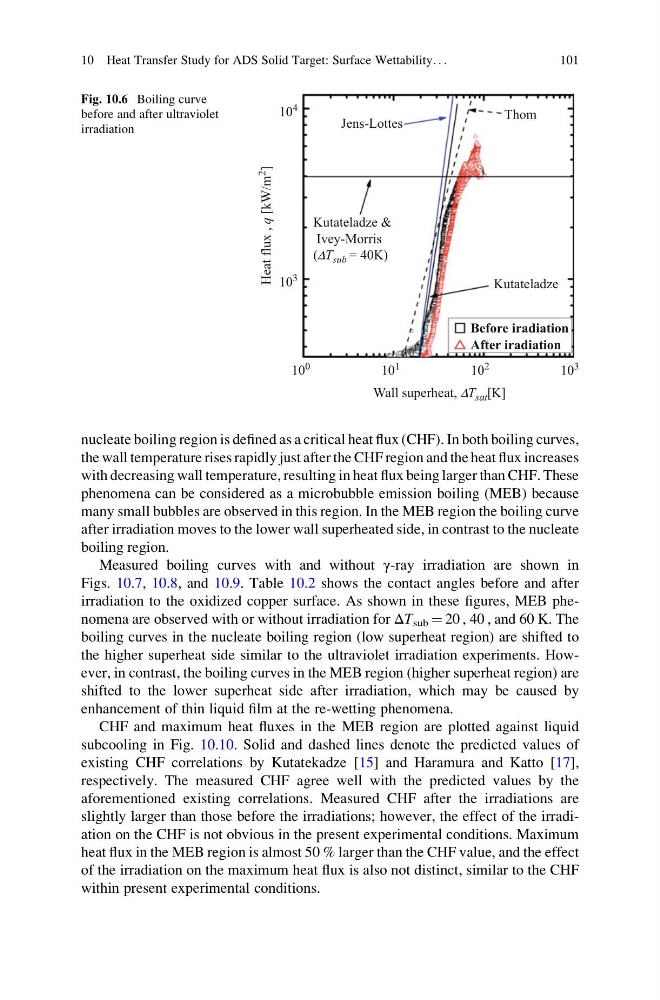
nucleate boiling region is defined as a critical heat flux (CHF). In both boiling curves,
the wall temperature rises rapidly just after the CHF region and the heat flux increases
with decreasing wall temperature, resulting in heat flux being larger than CHF. These
phenomena can be considered as a microbubble emission boiling (MEB) because
many small bubbles are observed in this region. In the MEB region the boiling curve
after irradiation moves to the lower wall superheated side, in contrast to the nucleate
boiling region.
Measured boiling curves with and without γ-ray irradiation are shown in
Figs. 10.7, 10.8, and 10.9. Table 10.2 shows the contact angles before and after
irradiation to the oxidized copper surface. As shown in these figures, MEB phenomena are observed with or without irradiation for ΔT sub ¼ 20 , 40 , and 60 K. The
boiling curves in the nucleate boiling region (low superheat region) are shifted to
the higher superheat side similar to the ultraviolet irradiation experiments. However, in contrast, the boiling curves in the MEB region (higher superheat region) are
shifted to the lower superheat side after irradiation, which may be caused by
enhancement of thin liquid film at the re-wetting phenomena.
CHF and maximum heat fluxes in the MEB region are plotted against liquid
subcooling in Fig. 10.10. Solid and dashed lines denote the predicted values of
existing CHF correlations by Kutatekadze [15] and Haramura and Katto [17],
respectively. The measured CHF agree well with the predicted values by the
aforementioned existing correlations. Measured CHF after the irradiations are
slightly larger than those before the irradiations; however, the effect of the irradiation on the CHF is not obvious in the present experimental conditions. Maximum
heat flux in the MEB region is almost 50 % larger than the CHF value, and the effect
of the irradiation on the maximum heat flux is also not distinct, similar to the CHF
within present experimental conditions.
10
0
10
1
10
2
10
3
10 3
10
4
Before iradiation
After iradiation
Heat flux ,
q [kW/m
2
]
Wall superheat, DT sat [K]
Thom
Kutateladze
Jens-Lottes
Kutateladze &
Ivey-Morris
(DT sub = 40K)
Fig. 10.6 Boiling curve
before and after ultraviolet
irradiation
10 Heat Transfer Study for ADS Solid Target: Surface Wettability. . .
101
the wall temperature rises rapidly just after the CHF region and the heat flux increases
with decreasing wall temperature, resulting in heat flux being larger than CHF. These
phenomena can be considered as a microbubble emission boiling (MEB) because
many small bubbles are observed in this region. In the MEB region the boiling curve
after irradiation moves to the lower wall superheated side, in contrast to the nucleate
boiling region.
Measured boiling curves with and without γ-ray irradiation are shown in
Figs. 10.7, 10.8, and 10.9. Table 10.2 shows the contact angles before and after
irradiation to the oxidized copper surface. As shown in these figures, MEB phenomena are observed with or without irradiation for ΔT sub ¼ 20 , 40 , and 60 K. The
boiling curves in the nucleate boiling region (low superheat region) are shifted to
the higher superheat side similar to the ultraviolet irradiation experiments. However, in contrast, the boiling curves in the MEB region (higher superheat region) are
shifted to the lower superheat side after irradiation, which may be caused by
enhancement of thin liquid film at the re-wetting phenomena.
CHF and maximum heat fluxes in the MEB region are plotted against liquid
subcooling in Fig. 10.10. Solid and dashed lines denote the predicted values of
existing CHF correlations by Kutatekadze [15] and Haramura and Katto [17],
respectively. The measured CHF agree well with the predicted values by the
aforementioned existing correlations. Measured CHF after the irradiations are
slightly larger than those before the irradiations; however, the effect of the irradiation on the CHF is not obvious in the present experimental conditions. Maximum
heat flux in the MEB region is almost 50 % larger than the CHF value, and the effect
of the irradiation on the maximum heat flux is also not distinct, similar to the CHF
within present experimental conditions.
10
0
10
1
10
2
10
3
10 3
10
4
Before iradiation
After iradiation
Heat flux ,
q [kW/m
2
]
Wall superheat, DT sat [K]
Thom
Kutateladze
Jens-Lottes
Kutateladze &
Ivey-Morris
(DT sub = 40K)
Fig. 10.6 Boiling curve
before and after ultraviolet
irradiation
10 Heat Transfer Study for ADS Solid Target: Surface Wettability. . .
101